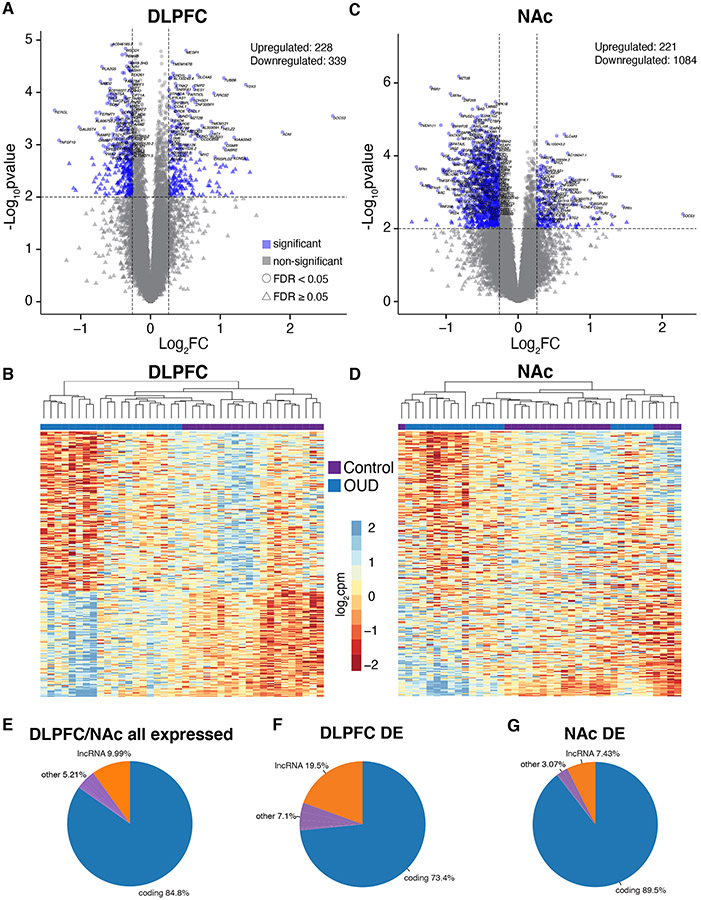
Fig. 1. Transcriptomic changes in DLPFC and NAc from OUD subjects.
A. Log2FC plotted relative to −log10p-value by volcano plot for differentially expressed (DE) transcripts in DLFPC. Horizontal dashed lines represent p-value significance cutoff of corrected p<0.01, while vertical dashed lines represent log2FC cutoffs of ≤−0.26 or ≥0.26 (FC≥1.2). Blue triangles represent DE transcripts that reach significance, log2FC, and FDR<0.05 cutoffs. B. Heatmap of the top 250 DE transcripts (corrected p<0.01 and log2FC of ≤−0.26 or ≥0.26) clustered by transcript and subject. Each column represents a subject (unaffected comparison, purple; OUD, blue). Subjects within groups cluster together. C. Volcano plot for DE transcripts in NAc. Note the large numbers of transcripts that are significantly reduced in expression compared to transcripts that are increased. D. Heatmap of the top 250 DE transcripts clustered by transcript and subject. Overall, subjects within groups cluster together with several groups of subjects forming separate clusters. E. Biotypes of all expressed transcripts in DLPFC and NAc in subjects with OUD. As expected, most of the transcripts encode protein coding genes. F. Biotypes of DE transcripts (corrected p<0.01 and log2FC of ≤−0.26 or ≥0.26) in DLPFC. Protein coding genes represent the majority of DE transcripts (blue; 73.4%) followed by lncRNAs (orange; 19.5%). G. Biotypes of DE transcripts in NAc. Protein coding genes represent the majority of DE transcripts (blue; 89.5%) followed by lncRNAs (orange; 7.43%).

