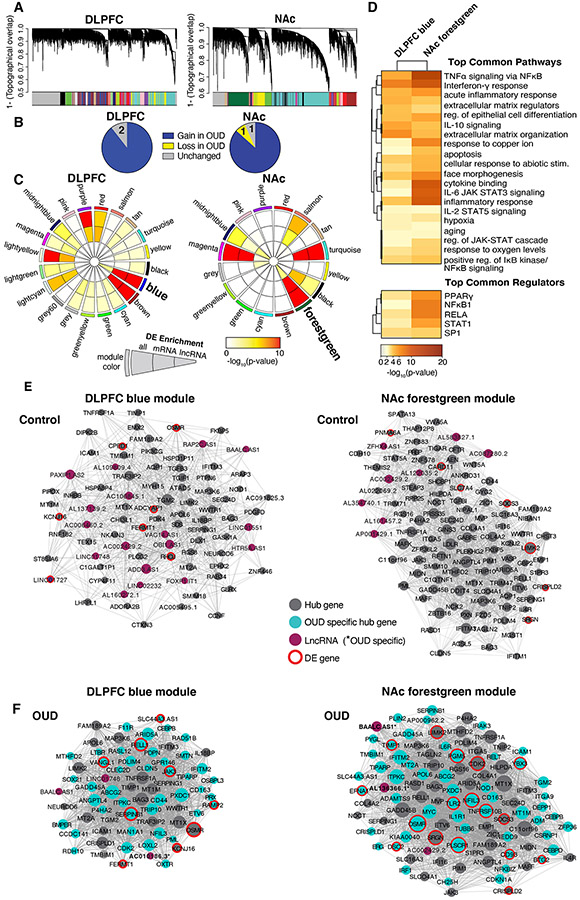
Fig. 4. OUD associated gene networks in DLPFC and NAc.
A. Weighted gene co-expression network analysis (WGCNA) was used to generate co-expression modules, with the network structure generated on each brain region separately. The identified modules that survived module preservation analysis were arbitrarily assigned colors and the dendrogram shows average linkage hierarchical clustering of genes. B. Pie charts summarize results from the module differential connectivity (MDC) analysis compared OUD to unaffected comparison subjects. The majority of modules gained in OUD subjects, revealing OUD-specific modules in both DLPFC and NAc. C. Circos plot identified by module names and colors. Enrichment for full list of differentially expressed (DE) transcripts, protein-coding (mRNA), and long non-coding RNAs (lncRNA), are indicated by semi-circle colors within each module, with increasing warm colors indicating increasing −log10 p-value. LncRNA enrichment was examined based on the high prevalence of these transcripts in the Biotype analysis (see Fig.1F,G). MDC analysis indicated a gain of connectivity in the DLPFC blue module and NAc forestgreen module in OUD. These modules were also enriched for DE mRNA and lncRNAs. D. Pathway enrichment analysis compared gene networks within the DLPFC blue module and NAc forestgreen module. Warmer colors indicate increasing −log10 p-value and highly shared pathways between the modules. Hub gene co-expression networks of the DLPFC blue module E. unaffected comparison subjects and F. OUD subjects, and networks of the forestgreen module in NAc E. unaffected comparison subjects and F. OUD subjects. Node size indicates the degree of connectivity for that gene. Turquoise nodes indicate OUD-specific hub genes, purple nodes indicate LncRNA gene, gray nodes indicate hub genes, and red halos indicate DE genes. Edges indicate significant co-expression between two particular genes.

