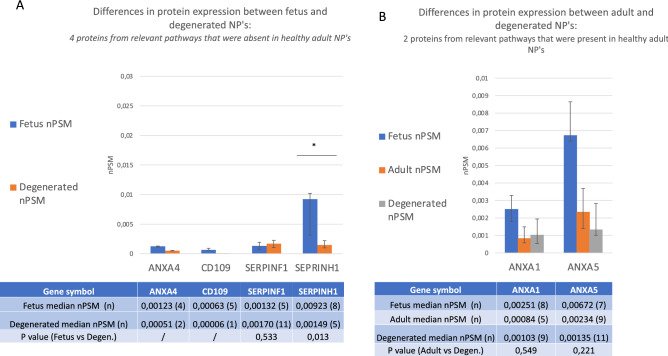
Figure 4.
Additional comparison with degenerated samples for the proteins significantly upregulated in anabolic pathways. (A) Includes the proteins that were absent in healthy adult NP’s, and shows differences in protein expression between fetus and degenerated discs. (B) Includes the proteins that were expressed in a significantly lower amount in healthy adult NP’s compared to fetus and shows the differences in protein expression between healthy adult and degenerated discs. The Y axis displays median normalized PSM’s per group, X axis shows protein gene symbols, error bars are Interquartile ranges and * indicates statistical significance. The attached table contains the median (number of samples) for each group, and provides the according Mann Whitney U p values if statistics could be performed (n ≥ 4). ‘/’ indicates that 3 or less samples were present in one of the groups and no statistical test could be performed.

