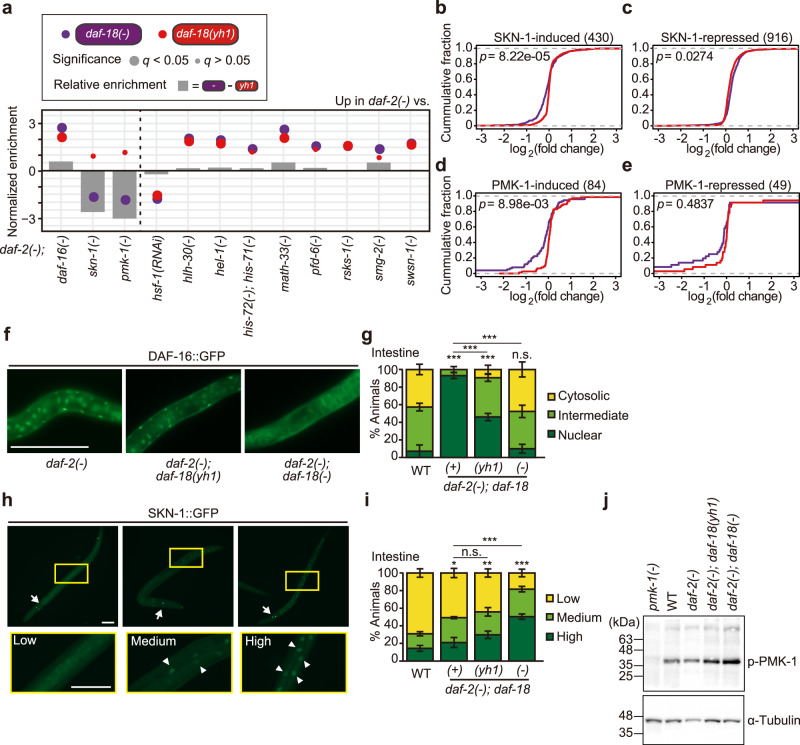
Fig. 5. Differential effects of daf-18(yh1) and daf-18(−) on downstream factors of IIS.
a Normalized enrichment of expression changes of indicated genes in daf-2(e1370) [daf-2(−)] mutants compared with daf-2(−); daf-18(yh1) and with daf-2(−); daf-18(nr2037) [daf-18(−)] mutants. DAF-16/FOXO34, SKN-1/NRF223, PMK-1/p38 MAP kinase35, HSF-1/heat shock factor 136, HLH-30/TFEB37, HEL-1/DEAD-box RNA helicase38, histone H3.339, MATH-33/deubiquitylating enzyme (at 25 °C)40, PFD-6/prefoldin 641, RSKS-1/S6K42, SMG-2/UPF143, and SWSN-1/BAF155/17044 target genes are shown (See Supplementary Table 2 for details). MATH-33 upregulates DAF-16/FOXO as its deubiquitylating enzyme40, and therefore the data with MATH-33 display a tendency similar to those with DAF-16/FOXO. Relative enrichment indicates the difference of gene expression changes caused by daf-18(−) and by daf-18(yh1) in daf-2(−) worms. q values were obtained by calculating the false discovery rate corresponding to each normalized enrichment. b–e Cumulative fraction of genes in an ascending order of the extent of gene expression changes conferred by daf-18(yh1) and daf-18(−) in daf-2(−) animals. b, c Shown are genes whose expression was upregulated (b) and downregulated (c) in daf-2(−) and daf-2(e1368) worms compared to skn-1(zu67) mutants23. d, e Genes whose expression was upregulated (d) and downregulated (e) in daf-2(e1368) worms compared to pmk-1(km25) mutants are shown35. Corresponding gene set enrichment analysis and calculation of cumulative fractions of other SKN-1/NRF2-induced or repressed genes are shown in Supplementary Fig. 9. f–i Effects of daf-18 mutations on subcellular localization of DAF-16::GFP and SKN-1::GFP in daf-2(−) mutants. f Representative images of the subcellular localization of DAF-16::GFP in the intestines of daf-2(−), daf-2(−); daf-18(yh1), and daf-2(−); daf-18(−) animals. Scale bar: 50 μm. g Quantification of data shown in (f) in addition to the subcellular localization of DAF-16::GFP in wild-type (WT). Cytosolic: predominant cytosolic localization, intermediate: partial nuclear localization, nuclear: predominant nuclear localization (n ≥ 32 for each condition, from four to seven independent trials). See Supplementary Fig. 8 for the subcellular localization of DAF-16::GFP in neurons, intestine, and hypodermis. h Representative images of worms expressing SKN-1::GFP at low, medium, or high levels in the nuclei of intestinal cells. Scale bar: 50 μm. Arrow: ASI neurons. Arrowhead: nuclear SKN-1::GFP. Yellow boxes indicate magnified trunk regions of animals expressing SKN-1::GFP. i Quantification of the nuclear localization of SKN-1::GFP in the intestinal cells of indicated strains. Low: very dim GFP in the nuclei, medium: < 50% of the nuclei with SKN-1::GFP, high: > 50% of the nuclei with SKN-1::GFP (n ≥ 291 for each condition, from eight independent trials). Error bars represent the standard error of the mean (s.e.m., *p < 0.05, **p < 0.01, ***p < 0.001, chi-squared test relative to WT unless otherwise noted). j Phospho-PMK-1 detection in WT, daf-2(−), daf-2(−); daf-18(yh1), and daf-2(−); daf-18(−) by using western blot assay (N = 5). pmk-1(km25) [pmk-1(−)] animals were used for the antibody validation (N = 2). α-tubulin was used as a loading control. See Source Data for data points used for the derivation of data.

