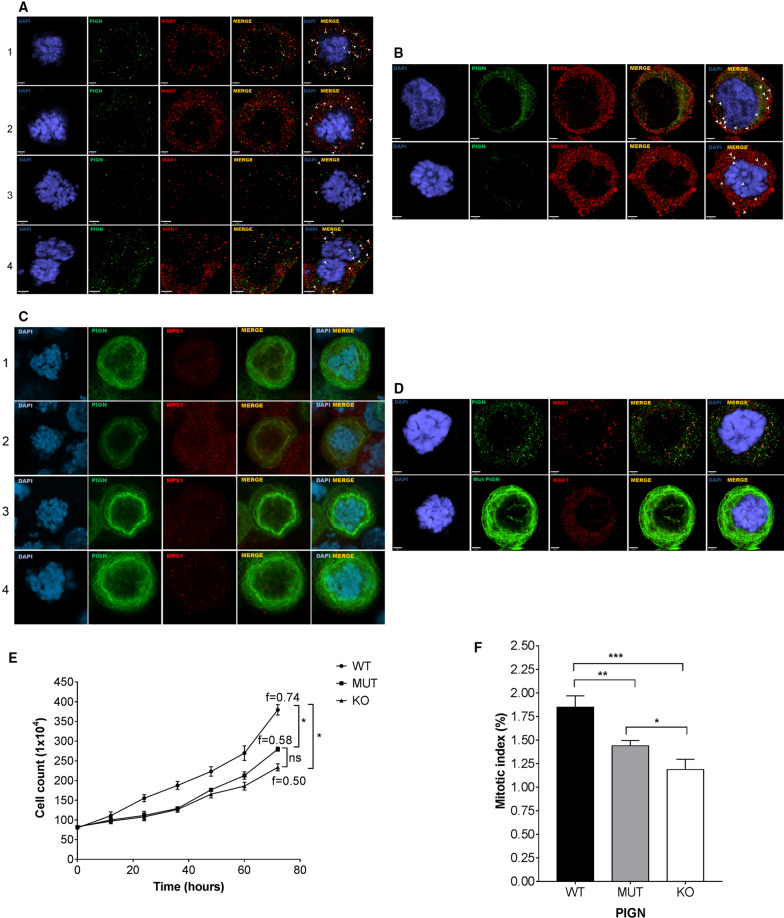
Figure 4.
PIGN colocalizes with SAC components during SAC activation. Colocalization (yellow) of PIGN (green) with (A) MAD1 (42% ± 10%), (B) MAD2 (65% ± 9%) and (C) MPS1 (red) in HEK293 cells. HEK293 PIGN KO cells were transfected with pMEPuro3HAPIGN plasmid for 48 h followed by treatment with nocodazole (100 ng/µl) for 12 h. % Colocalization (mean % ± SEM) was calculated based on proportions of overlapping red and green voxels or the object Pearson correlation. (D) Colocalization of the exon 14/15 intron-retaining mutant PIGN (mut PIGN) with MAD1. The mutant plasmid was cloned by inserting a 38 bp partial intron sequence into the wild-type gene in the pMEPuro3HAPIGN plasmid via restriction enzyme digestion and re-ligation. The cells were incubated for 48 h followed by treatment with nocodazole (100 ng/μl) for 12 h. Cells transfected with either mutant or wild-type plasmid were fixed with 4% paraformaldehyde and treated with mouse anti-MAD, anti-MAD2 or anti-MPS1, and rabbit anti-HA, followed by treatment with fluorescently-labeled secondary antibodies. Chromosomes were stained with DAPI (blue). Laser scanning confocal microscopy was used to visualize the stained cells. Scale bars, 2–3 µm. The cells were fixed with 4% paraformaldehyde and treated with mouse anti-MAD, anti-MAD2 or anti-MPS1, and rabbit anti-HA, followed by treatment with the respective fluorescently-labeled secondary antibodies. Chromosomes were stained with DAPI (blue). Laser scanning confocal microscopy was used to visualize the stained cells, and image analyses were conducted using the Volocity 6.3 High-performance 3D imaging software (PerkinElmer). All images were deconvolved and imaging analyses performed with Huygens Professional version 19.04 (Scientific Volume Imaging, The Netherlands, http://svi.nl). Scale bars, 2-3 µm. N.D = not determined. (E) PIGN loss in HEK293 cells decreased cell cycle frequency in HEK293 cells. Cell cycle frequency (1/day) was significantly lower in HEK293 KO cells ectopically overexpressing the PIGN mutant (MUT) (*p = 0.0276) or empty vector (KO) control (*p = 0.0444) compared to those expressing wild-type PIGN (WT). Mean cell counts were obtained over 3 days at 12-h intervals in three separate experiments (n = 3). The cell cycle frequency (f) was calculated using the formula derived from the formula Nt = N0 2tf where Nt is the number of cells at time t, N0 is the initial number of cells and f is the frequency of cell cycles per unit time. M. Beals, L. Gross, S. Harrell. 1999. Quantifying cell division. Error bars indicate mean and standard deviation. (F) Mitotic index was significantly reduced in HEK293 KO cells ectopically overexpressing mutant PIGN (MUT) (**p = 0.0056) or empty control vector (KO) (***p = 0.0004) compared to wildtype (WT) PIGN. Error bars are representative of the mean and standard error from the mean in three independent experiments (n = 3).

