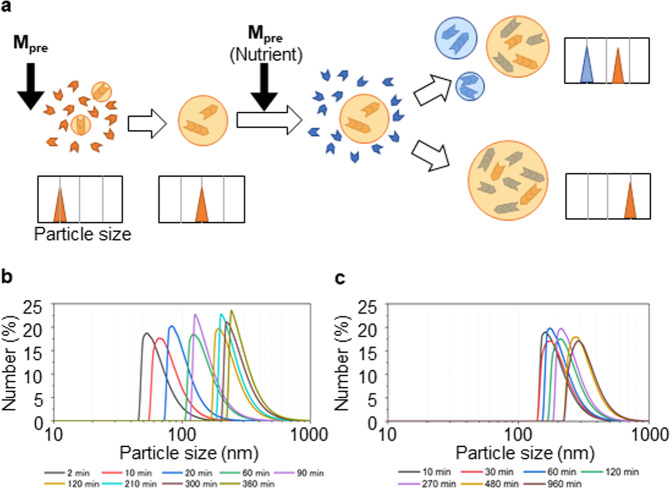
Fig. 4. Measurement of the sizes of self-reproducing LLPS-formed droplets.
a Schematic particle size distributions after the first and second addition of Mpre (nutrient) and DTT. After the first addition, the particle size increased, and the corresponding distribution shifted to the right. After the second addition, if the LLPS-formed droplets did not self-reproduce, a new peak centred at a particle size smaller than that of the original population appeared (upper right). However, if the LLPS-formed droplets self-reproduced, only the original population would be detected, and the corresponding peak would shift to the right (lower right). b Particle size distributions measured at different times during the interval between 10 min and 24 h after addition of Mpre (10 mM) and DTT (25 mM) to water. c Particle size distributions of the solution after the second addition of Mpre and DTT 24 h after the first addition (the same amounts of Mpre and DTT were added to the solution). Only one population was detected after the second addition. For both b, c, the x-axis refers to the particle size, and the y-axis to the percentage of droplets of that size to the droplet population. Source Data of Fig. 4b, c are provided in the Source Data File.

