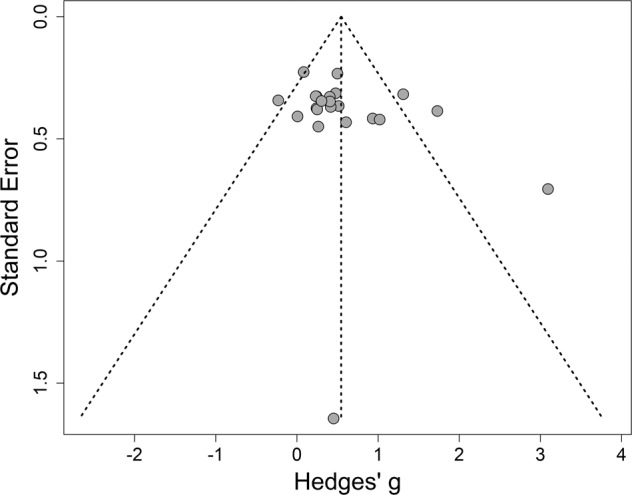
Fig. 2. Funnel plot of the publication bias.

Studies with a smaller sample size are expected to have higher standard error, and are therefore expected to be located at the lower end of the y-axis, while the studies with more participants are expected to show a lower standard error, and thus be at the upper end of the y-axis. SE = Standard error, Hedges’ g = The Hedges’ bias-corrected standardized mean difference which was used to calculate the effect size.
