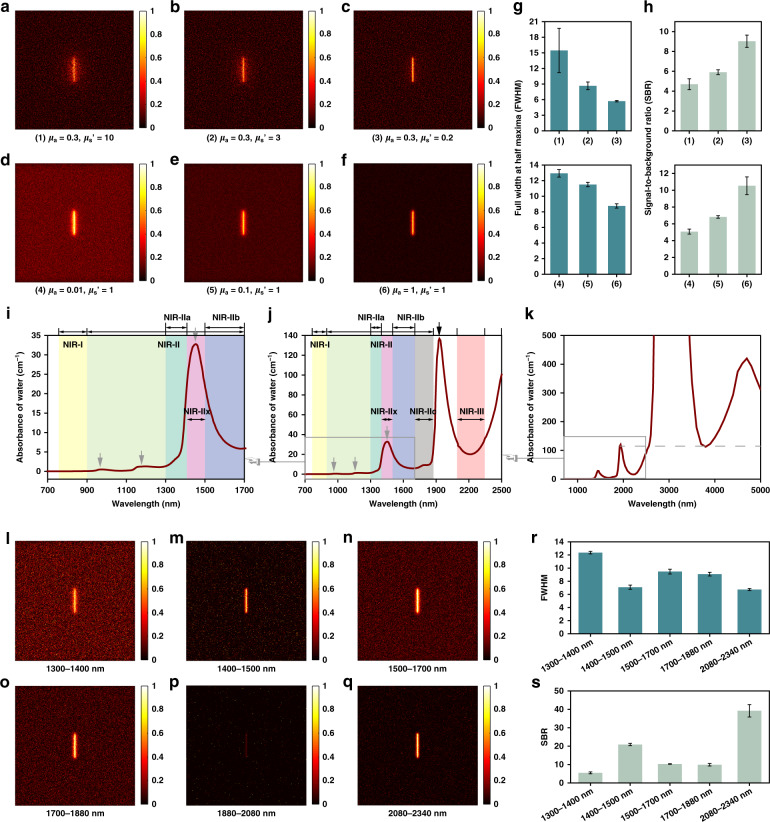
Fig. 2. The simulation results of NIR bio-tissue imaging via the Monte Carlo method.
Images of a line source through a bio-tissue of 1-mm thickness with scattering anisotropy factor (g) of 0.9, absorption coefficient (μa) of 0.3 mm−1, and varying reduced scattering coefficient (μs’) (a) μs’ = 10 mm−1, (b) μs’ = 3 mm−1 and (c) μs’ = 0.2 mm−1. Images of a line source through a bio-tissue of 1 mm thickness with g of 0.9, μs’ of 1 mm−1 and varying absorption coefficient (d) μa = 0.01 mm−1, (e) μa = 0.1 mm−1, and (f) μa = 1 mm−1. The (g) FWHM and (h) SBR analyses of the samples in (a–f). The light absorption spectra of water within (i) 700–1700 nm38, (j) 700–2500 nm38, and (k) 900–5000 nm39. The gray arrows pointed out the absorption peaks and the gray dashed line in (k) represented the absorbance at 1930 nm. Equivalent images of a line source through a bio-tissue of 1 mm thickness in (l) 1300–1400 nm, (m) 1400–1500 nm, (n) 1500–1700 nm, (o) 1700–1880 nm, (p) 1880–2080 nm, and (q) 2080–2340 nm. The (r) FWHM and (s) SBR analyses of the samples in (l–q).

