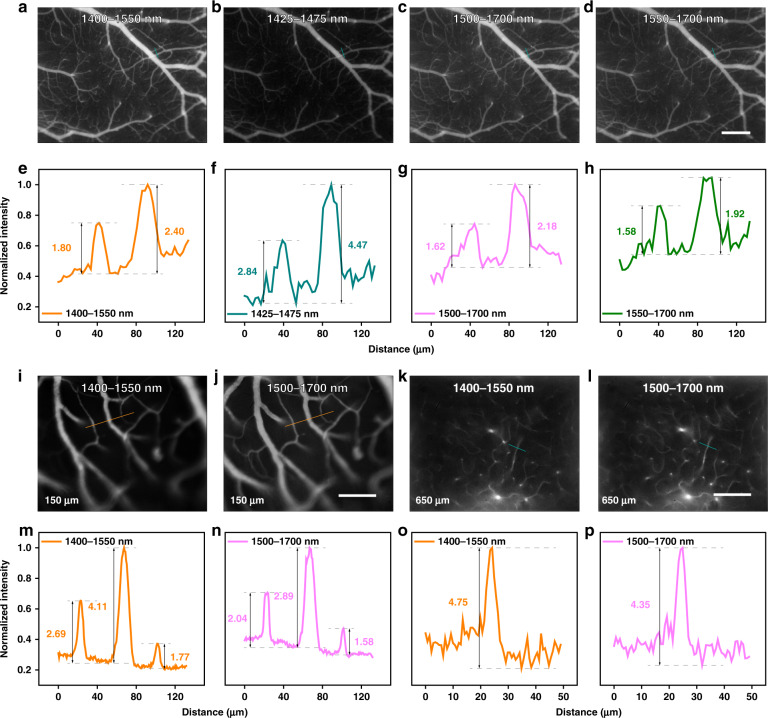
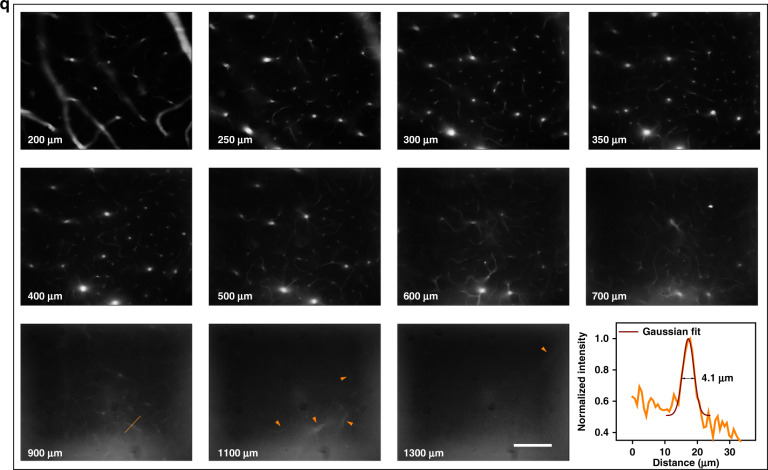
Fig. 7. In vivo fluorescence wide-field microscopic imaging beyond 1400 nm.
The ×5 microscopic imaging of cerebral vasculature in the same mouse in (a) 1400–1550 nm, (b) 1425–1475 nm, (c) 1500–1700 nm, and (d) 1550–1700 nm. Scale bar: 300 μm. e–h Cross-sectional fluorescence intensity profiles along the indigo lines of the blood vessel in (a–d). The numbers show the SBRs. The ×25 microscopic imaging of cerebral vasculature in the same mouse at depth of 150 μm in (i) 1400–1550 nm and (j) 1550–1700 nm. Scale bar: 100 μm. The ×25 microscopic imaging of cerebral vasculature in the same mouse at depth of 650 μm in (k) 1400–1550 nm and (l) 1550–1700 nm. Scale bar: 100 μm. Cross-sectional fluorescence intensity profiles along (m, n) the brown lines in (i, j) and (o, p) the indigo lines in (k, l). The numbers show the SBRs. q ×25 microscopic imaging of cerebral vasculature in 1400–1550 nm at various depths below the skull and the fluorescence intensity analysis of the blood vessel at the depth of 900 μm (the brown line). The brown arrows show the deep and tiny capillaries. Scale bar: 100 μm.


