Figure 2.
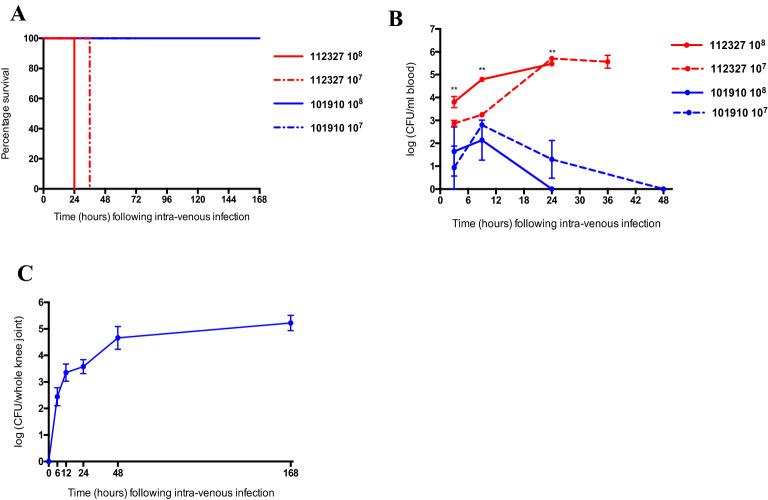
In vivo characterisation of emm type 32.2 (isolate 112,327) and emm type 1.0 (isolate 101,910) in a model of invasive GAS infection. (A) Kaplan Meier plots representing percentage survival of CD1 mice (n = 10 per group) following 108 and 107 CFU intravenous infection with emm type 1.0 (isolate 101,910) and emm type 32.2 (isolate 112,327). (B) The bacterial CFU in blood for each isolate and infectious dose over time. (C) The bacterial CFU in knee joints of CD1 mice (n = 10, knee joints n = 20) following intravenous infection with 107 CFU (50 μl) of emm type 1.0 (isolate 101,910). **p value < 0.01 when analysed using a one-way ANOVA followed by a Kruskall-Wallis multiple comparisons test.

