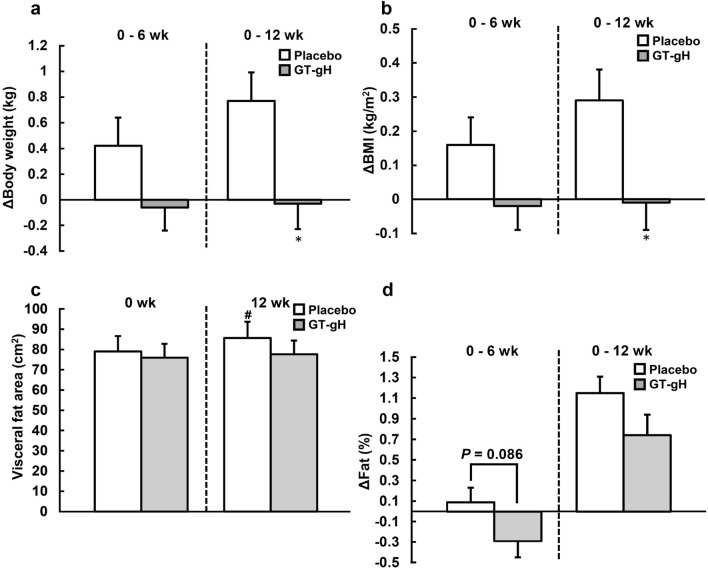
Figure 2.
Diachronic change in visceral fat area, body weight, BMI and fat in the placebo (n = 27) and GT-gH (n = 29) groups. (a) Body weight, (b) BMI and (d) fat were measured by a dual-frequency body composition analyzer, and the changes in their values were analyzed by an independent two-sample t-test. (c) The visceral fat area was measured by PET-CT and Fat Checker. For between-group comparisons, the values were analyzed using an independent two-sample t-test. *P < 0.05 (vs. placebo). For within-group comparisons, the values were analysed by a paired t-test. #P < 0.05 (vs. week 0). Grey bars represent GT-gH, and open bars represent placebo. Data are shown as means ± SE. BMI, body mass index; GT-gH, green tea with α-glucosyl hesperidin; PET-CT, positron emission tomography with computed tomography.

