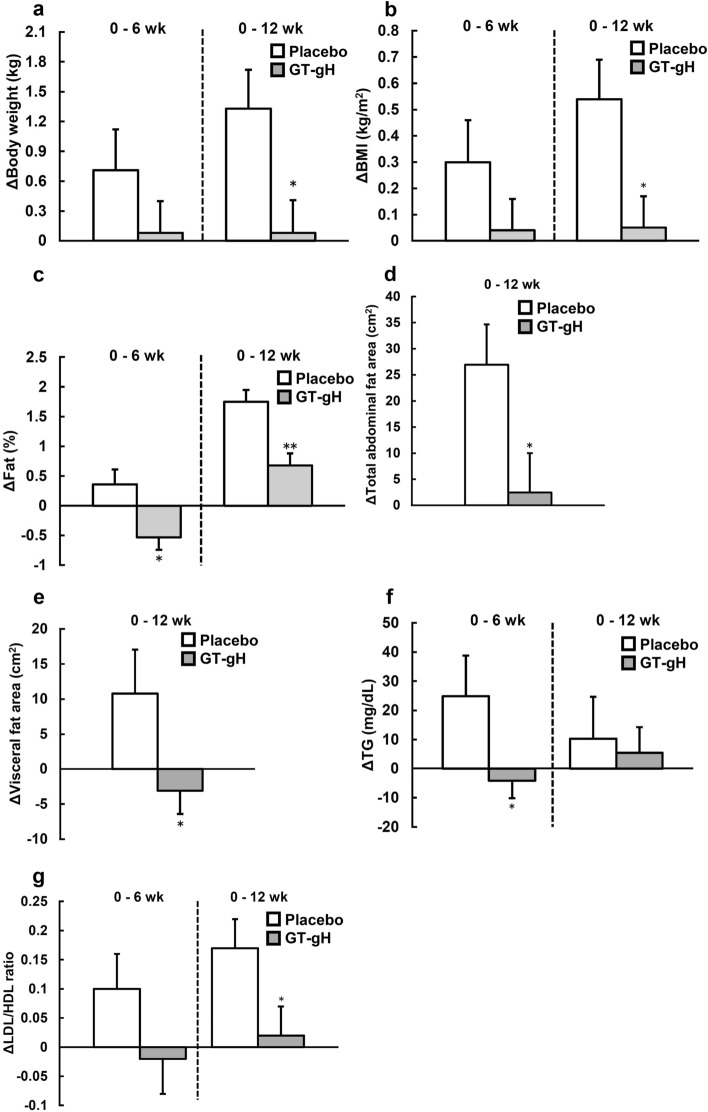
Figure 3.
Subgroup analysis of the change amount of obesity-related parameters in subjects below 50 years old in the placebo (n = 10) or GT-gH (n = 13) groups. (a) Body weight, (b) BMI, and (c) fat were measured by a dual-frequency body composition analyzer. (d) Total abdominal fat area and (e) visceral fat area were measured by PET-CT and Fat Checker. (f) TG was measured by free-glycerol elimination method, (g) LDL/HDL ratio was measured by selective solubilization method and selective suppression method. (a–g) were analyzed by independent two-sample t-test. *p < 0.05, **p < 0.01 (vs. placebo). Gray bars represent GT-gH, and open bars represent placebo. Data are shown as means ± SE. GT-gH green tea with α-glucosyl hesperidin; LDL/HDL ratio ratio of low-density lipoprotein to high-density lipoprotein; TG triglyceride.

