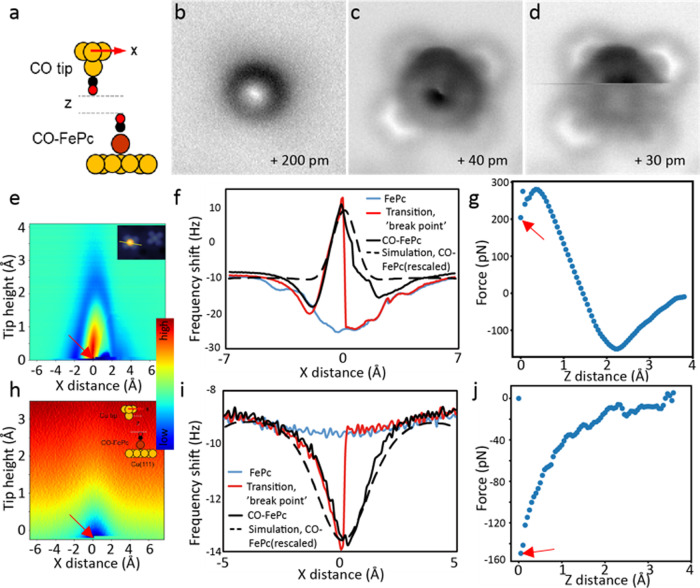
Fig. 2. Rupturing the dative CO-FePc bond using AFM tips.
a Schematic of a CO-AFM tip interacting with CO-FePc (Cu: yellow; C: black; O: red; Fe: brown). b–d Non-contact AFM images obtained at different tip heights (z); the final dislodging of CO occurs at z = +30 pm. e 3D force map of the frequency shift (Δf) vs. AFM tip heights (z) and horizontal position (x), with a CO tip. Step size is 5 pm in z, and the scan path in x is across the center of the Fe, as shown in the inset. The tip position at bond rupture is indicated by the breakpoint (arrow). f Frequency shift (Δf) obtained in the horizontal (x) direction before, during (indicated by the disjointed curve), and after the bond rupture. g The force curve deconvoluted from Δf at the breakpoint in the vertical (z) direction. h 3D force map of the frequency shift (Δf) showing quantitative rupture of the dative bond, obtained using a Cu tip; the insert shows schematic of interaction between a Cu tip and CO-FePc. i Frequency shift (Δf) obtained using a Cu tip scanned in the horizontal (x) direction. j The deconvoluted force curve at the breakpoint in the vertical (z) direction using a Cu tip. (Red arrows indicate the bond rupture point. Long-range background forces are subtracted in Figures g and j).

