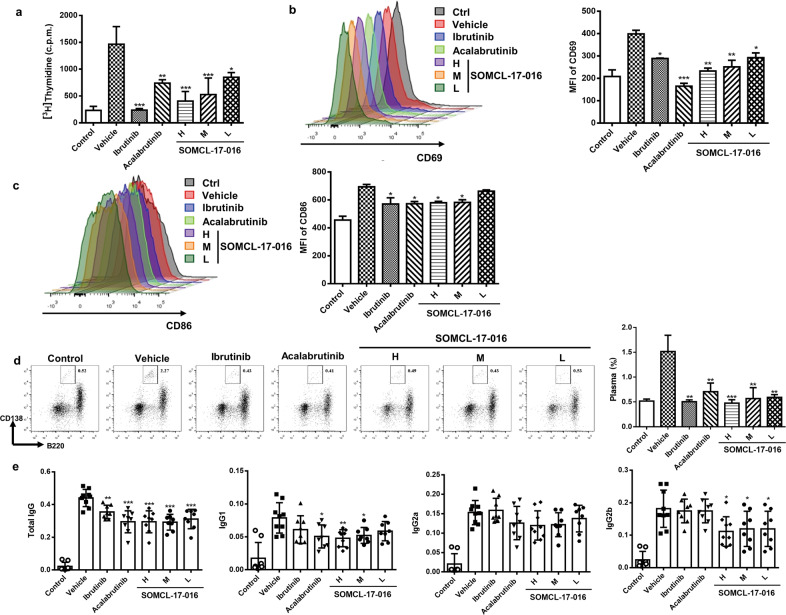
Fig. 4. SOMCL-17-016 impeded B cell activation and suppressed autoantibody production in CIA mice.
a Splenocytes isolated from CIA mice were stimulated with anti-IgM (10 μg/mL) and cultured for 72 h. Cell proliferation was measured by the [3H]-thymidine incorporation assay. Splenocytes isolated from CIA and control mice were stimulated with anti-IgM (10 μg/mL) and cultured for 24 h. Flow cytometric analysis of B cell activation by CD19 and CD69 staining (b) or CD19 and CD86 staining (c). Representative (left) and statistical results (right) are shown. d Flow cytometric analysis of plasma cells by B220 and CD138 staining. Each plot shows data for an individual mouse (n = 5). e Serum levels of total anti-CII IgG, IgG1, IgG2a and IgG2b in CIA mice and normal control mice. Each plot shows data for an individual mouse (n = 8 or 9). The data are shown as the means ± SEMs; *P < 0.05, **P < 0.01 and ***P < 0.001, significantly different from the vehicle group.

