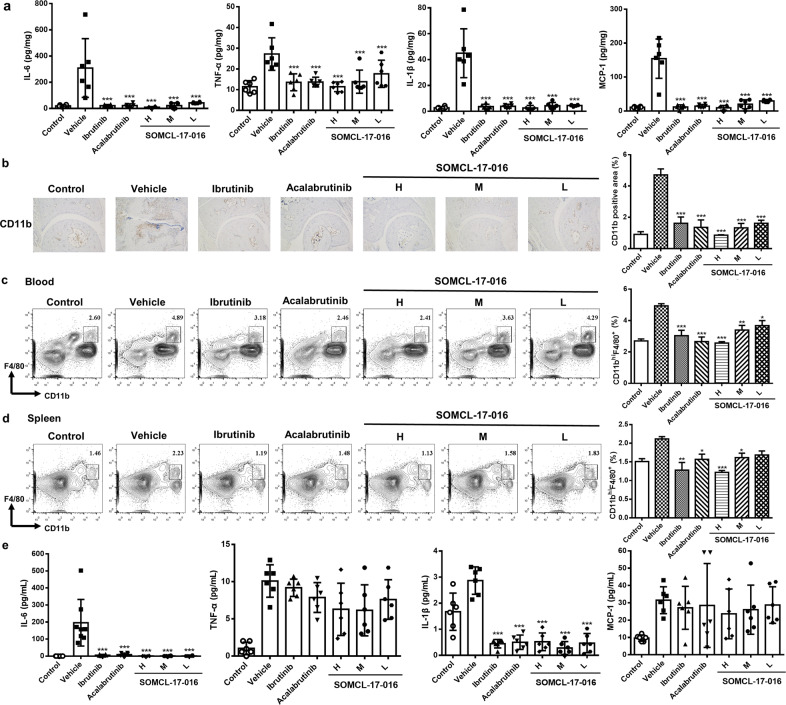
Fig. 6. SOMCL-17-016 inhibited systemic inflammatory macrophages and tissue inflammation in joints.
a Cytokine production profile in tissue homogenates. Each plot shows data for an individual mouse (n = 6). b Immunohistochemical staining for CD11b in joint tissue (magnification of ×100). Representative (left) and statistical results (right) are shown. Each plot shows data for an individual mouse (n = 3). Flow cytometric analysis of CD11bhiF4/80+ macrophages in the (c) peripheral blood and (d) spleens of mice from each group. Representative (left) and statistical results (right) are shown. Each plot shows data for an individual mouse (n = 3). e Levels of cytokines in the serum. Each plot shows data for an individual mouse (n = 6). The data are shown as the means ± SEMs; *P < 0.05, **P < 0.01 and ***P < 0.001, significantly different from the vehicle-treated group.

