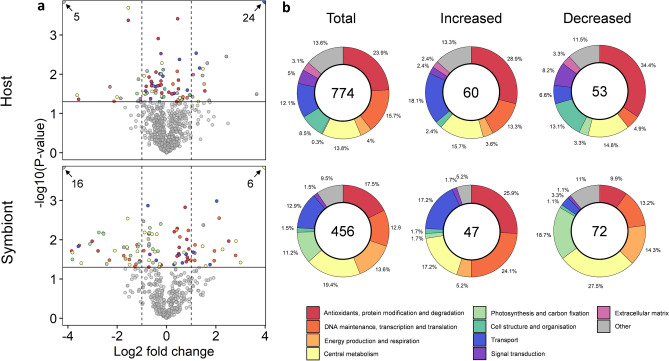
Figure 3.
Overview of proteomic analyses: (a) Funnel plot of log2 fold change vs −log10 p-value of detected proteins and (b) total number and proportional changes in differentially expressed proteins grouped at the level of biological and molecular function (GO-term classification) for the host and symbiont proteomes in response to elevated temperature. Vertical dashed lines indicate a log2 fold-change of 1, solid horizontal line indicates significance value (−log10 p-value < 0.05). Numbers inside circles indicate abundance of total and differentially expressed proteins detected in host and symbiont. Colours indicate functional grouping of proteins.

