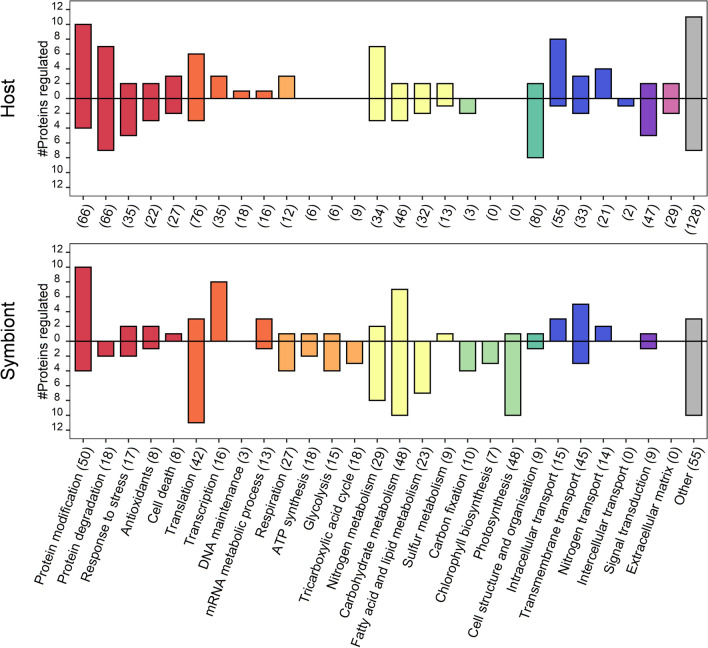
Figure 4.
Number of differentially expressed proteins detected in the host and symbiont of Acropora millepora grouped by sub-categories. Positive bars show the number of proteins that increased in abundance, while negative bars show the proteins that decreased in abundance with elevated temperature. Numbers in parentheses on the x-axis indicate the total (including unchanged) number of proteins detected for each sub-category. Colours represent major functional groups, as described in the legend of Fig. 3.

