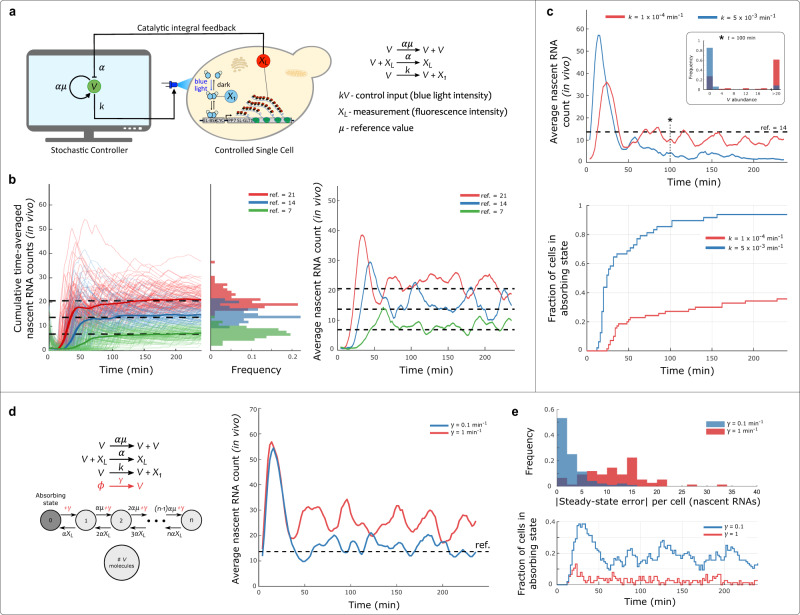
Fig. 2. Autocatalytic Integral Controller in Cyberloop.
a Cyberloop implementation of the Autocatalytic integral biomolecular controller. Left: the cellular readout, XL, is measured via fluorescence microscopy. Its copy-number, quantified from fluorescence intensity, is used to update the reaction propensities of the controller network, implemented in a computer. The control action is performed at regular intervals by applying a light input to the controlled cell. The applied light input intensity is proportional to the controller species (V) copy-number obtained from stochastic simulation in the computer. Right: Autocatalytic integral controller reactions21. b Demonstration of set-point tracking by the Autocatalytic Integral Controller motif (under the constraint V > 0). Left: three Cyberloop runs with different reference values (dashed lines) were performed. Thin lines indicate cumulative time averages of nascent RNA counts in individual cells, while thick lines represent the population average. Center: distribution of the average nascent RNA count per cell over the course of the experiment. Right: population average of nascent RNA count across cells as time progresses in these three experiments (Experimental parameters: initial V = 1 and μ = (7, 14, 21); Number of cells: red - 98, blue - 86, green - 102). c Effect of absorbing state on the Autocatalytic Integral Controller motif. Two set-point tracking experiments with differing values of parameter k show the effect of this parameter on the average time needed for the controller species abundance to reach zero, the absorbing state of the system. Top: time-course evolution of average nascent RNA counts for the controller with high and low k values. Inset: distribution of V copy-numbers for all the cells at time t = 100 min in the two experiments. Bottom: shows the fraction of cells in the absorbing state as a function of time. As time progresses in the experiment, more cells fall into the absorbing state due to stochasticity, thus making the controller ineffective for set-point tracking under stochastic setting (Experimental parameters: initial V = 300 and μ = 14; Number of cells: red - 70, blue - 48). d, e Effect of promoter leakiness on Autocatalytic Integral Controller – addition of a basal production (leakiness) rate of controller species V eliminates absorbing state. d Left: an additional reaction (in red) is added to the Autocatalytic Controller motif. With this addition, the absorbing state is removed, as the basal production rate enables the system to leave the state V = 0 with propensity γ. This basal production rate of V affects the tracking properties of the controller under stochastic setting. Right: time-course evolution of average nascent RNA counts for the controller with two different basal production rates. e Bottom: fraction of cells in the absorbing state as time progresses in the two experiments. Top: steady-state error (absolute value) distribution of nascent RNA counts for all the cells. Sufficiently small basal production rate eliminates the absorbing state and makes the controller effective in robust set-point tracking even under the stochastic setting. (Experimental parameters: initial V = 300 and μ = 14; Number of cells: red - 76, blue - 96). Source data are provided as a Source Data file.

