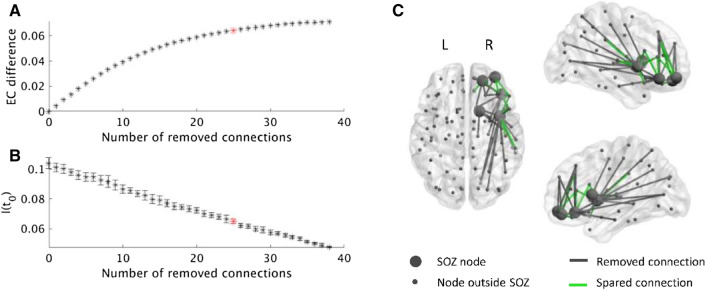
Figure 3.
Example of selecting the connections to remove for patient 15. (A) The selection was found separately for each number of connections using simulated annealing and the EC difference. After the removal of some connections from the SOZ to the rest of the brain, the EC difference of the SOZ increased. Removing all connections as in the surgery resulted in the highest EC difference. However, a 10% smaller decrease in EC was achieved by removing only 25 of the 38 connections, thereby sparing 13 connections (red star). (B) We calculated the actual effect of each resection on the seizure propagation model by measuring I(t0) after the resection took place. I(t0) decreases in a roughly linear manner with the number of removed connections. The red star indicates the resection corresponding to a 90% decrease in EC difference. Errorbars indicate the standard deviation among 10 iterations of the SIR model averaged over 1000 realizations. (C) The connections from the SOZ to the brain regions outside the SOZ are displayed, including the 13 spared connections (green). Parts of the figure were visualized with the BrainNet Viewer toolbox (Xia et al. 2013) (http://www.nitrc.org/projects/bnv/).

