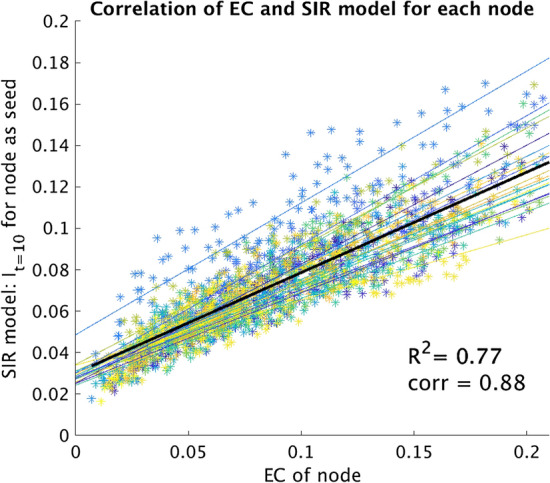
Figure 7.

Correlation of the nodal EC with the SIR model for all patients. The EC was calculated for each of the 92 nodes in the structural network. For the SIR model, each node was activated separately at the start (only one seed) and the number of active nodes at time 10 (It=10) was averaged over 10,000 runs. The correlation was measured independently for each patient (thin coloured lines); on average the Pearson’s correlation coefficient was 0.95 ± 0.02. When considering all data points together, the correlation decreased to 0.88 but was still strong.
