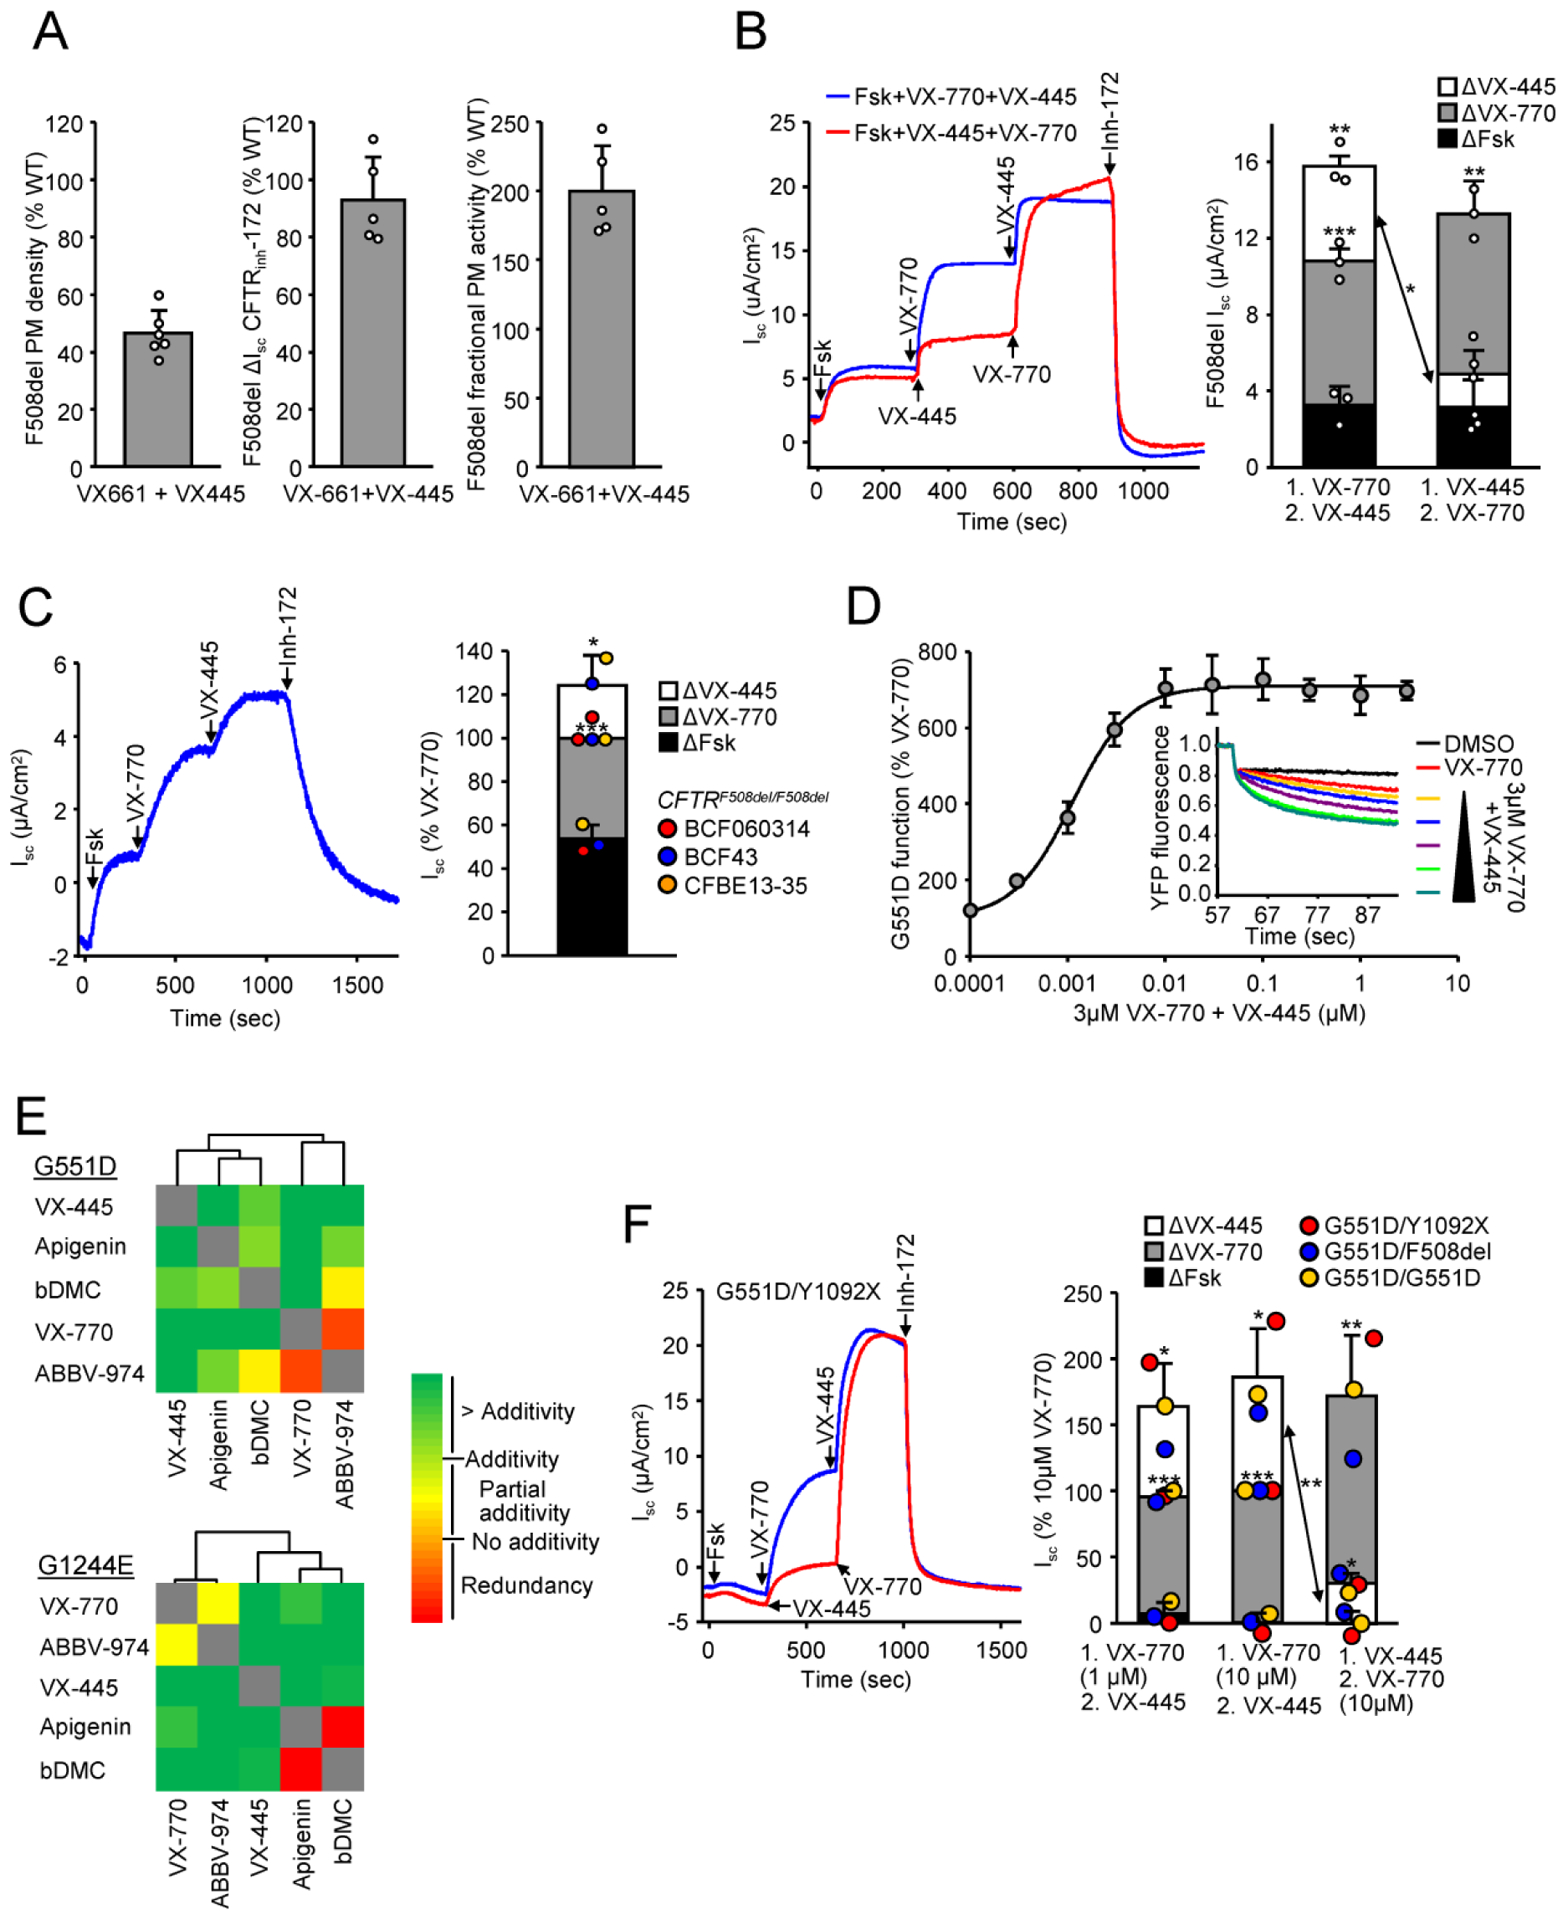
Figure 1. VX-445 (elexacaftor) potentiates the activity of F508del and gating mutants.

A) Fractional PM activity of VX-661+VX-445 corrected (3 μM VX-661, 2 μM VX-445, 24 hours, 37°C) F508del-CFTR calculated from PM density (left, n = 6 independent experiments) and short-circuit current (Isc, middle, n = 5 independent experiments) expressed as percentage of WT-CFTR expressing CFBE. Isc was measured after sequential addition of 20 μM forskolin and 10 μM VX-770, followed by CFTR inhibition with 20 μM CFTRinh-172. The fractional PM activity (right) was calculated as the ratio of PM density and Isc, and normalized to WT. Data are means ± SD. B) Representative traces (left) of the Isc of VX-661 corrected (3 μM, 24 hours, 37°C) F508del in CFBE activated with forskolin (Fsk, 20 μM) and potentiated with VX-770 (10 μM) followed by VX-445 (2 μM) or in reverse order. At the end of the experiment CFTR was inhibited with CFTRinh-172 (20 μM). Quantification of the Isc (right, n = 3 independent experiments) shows the contribution of Fsk, VX-770 and VX-445 to the maximal current, depending on the order of potentiator addition. Data are means ± SD, *P < 0.05, **P < 0.01, ***P<0.001 by unpaired, two-tailed Student’s t-test. C) Representative traces (left) and quantification of the Isc (right) in HBE isolated from 3 patients homozygous for F508del-CFTR which were corrected with VX-661 (3 μM, 24 hours, 37°C), expressed as percentage of VX-770 induced currents. F508del was activated with forskolin (Fsk, 20 μM) and potentiated with VX-770 (10 μM) and VX-445 (2 μM) followed by inhibition with CFTRinh-172 (20 μM). Data are means ± SD, *P < 0.05, ***P<0.001 by unpaired, two-tailed Student’s t-test. D) Representative traces (insert) and dose-response of VX-445 for the phosphorylated G551D-CFTR potentiation in presence of 3 μM VX-770, measured by halide-sensitive YFP quenching assay in CFBE cells (n = 3 independent experiments). Values are expressed as percentage of the response to 3 μM VX-770. E) Combinatorial profiling and clustering of mechanistic classes of potentiators for G551D-CFTR (top) or G1244E-CFTR (bottom) in CFBE cells. Heat map of the combinatorial profiling was established by calculating the dual potentiator effect in relation to their theoretical additivity, determined by the halide sensitive YFP quenching assay (n = 3–5 independent experiments). Combinatorial profiles were subsequently used to cluster compounds. Clustering was performed by average linkage analysis followed by Euclidean distance determination. F) Representative traces (left) and quantification (right) of the effect of VX-770 (1 μM or 10 μM) and VX-445 (2 μM) on the forskolin-stimulated Isc in HNE from three patients, homozygous or heterozygous for the G551D mutation, expressed as percentage of 10 μM VX-770 induced currents. Data are means ± SD, *P < 0.05, **P < 0.01, ***P<0.001 by unpaired, two-tailed Student’s t-test.
