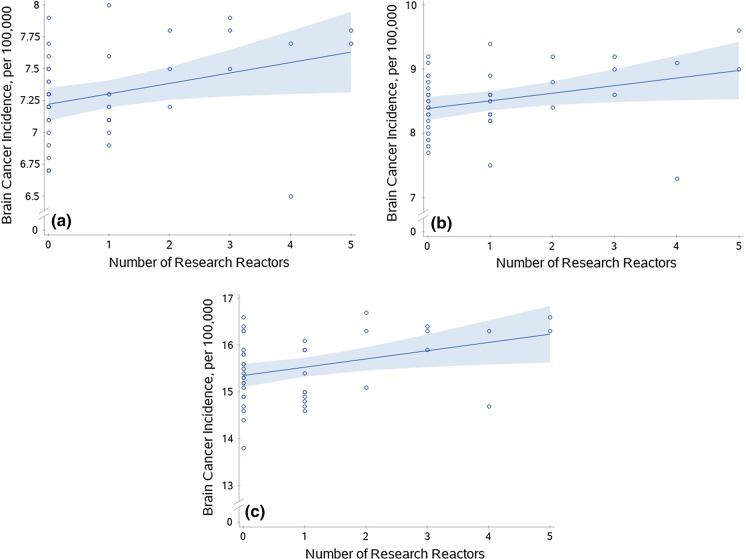
Fig. 2.
Brain cancer incidence rates and nuclear research reactors. Scatterplots of brain cancer incidence by state and the number of nuclear research reactors per state. a) Male and female combined incidence for all ages for research reactors (p = 0.0319). b) Male incidence for all ages for research reactors (p = 0.0277). c) Male and female combined incidence for ages 50 and older for research reactors (p = 0.0163). Lines were generated from prediction mean values from a simple linear model (research reactor/facility as only predictor variable) in SAS and bands are 95% confidence limits of the mean

