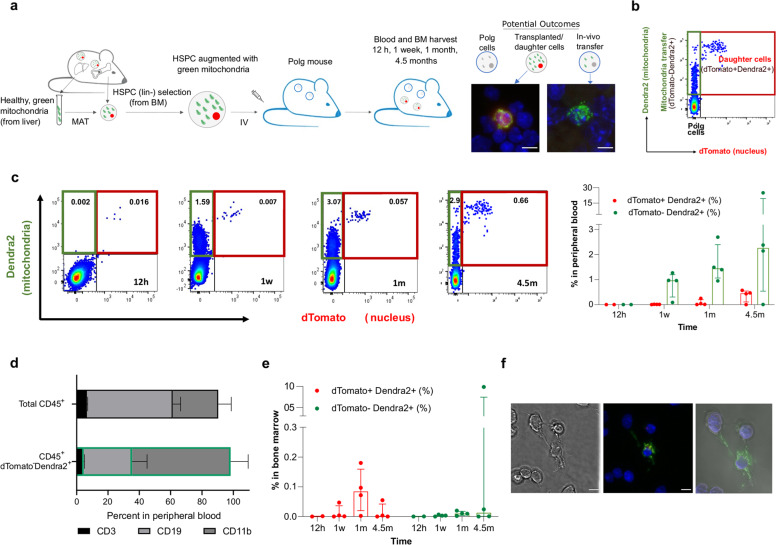
Fig. 4. Demonstration of continuous transfer of exogenous mitochondria in blood of Polg mouse model.
Lineage negative cells ubiquitously expressing red-labeled nucleus (dTomato) and green-labeled mitochondria (Dendra) derived from ROSAnT-nG/PhAMexcised mice were augmented with Dendra2+ mitochondria for 21 h and injected to Polg mice dosed at age 24–27 weeks (males) and 30-34 weeks (females). At 12 h, 1 w, 1 m, and 4.5 m post-injection blood was drawn and BM was extracted and both were analyzed by flow cytometry and confocal microscopy. a Graphical presentation of experimental design and a representative image of confocal microscopy of dTomato+Dendra2+ (left) and dTomato-Dendra2+ (right) found in bone marrow 1 m post-injection. Scale bar 5 µm. b Representation of flow cytometry analysis, which is expected to detect three types of cells: Polg cells, transplanted/daughter cells (red box, dTomato+Dendra2+) and Polg cells which received mitochondrial transfer (green box, dTomato-Dendra2+). c Representative figure of flow cytometry analysis of dTomato-Dendra2+ cells within CD45+ cell population in peripheral blood 12 h, 1 w, 1 m and 4.5 m post-injection (left). Percentages of dTomato+Dendra2+ cells and dTomato-Dendra2+ cells in peripheral blood (right). d Percentages of CD3+ T cells, CD19+ B cells and CD11b+ myeloid cells within the CD45+ and dTomato-Dendra2+ populations in peripheral blood 1 m post-treatment. e Percentages of dTomato+Dendra2+ cells (left) and dTomato-Dendra2+ cells (right) in the bone marrow. f Representative image of confocal microscopy analysis of BM extracted cells at 4.5 months after treatment, demonstrating Dendra2+ mitochondria transfer between adjacent cells. Left, differential interference contrast (DIC); center, merged florescent image from DAPI, Dendra2 and dTomato channels. Scale bar, 5 µm; right, 3D reconstruction of the Z-stack images. BM bone marrow, HSPCs hematopoietic stem and progenitor cells.

