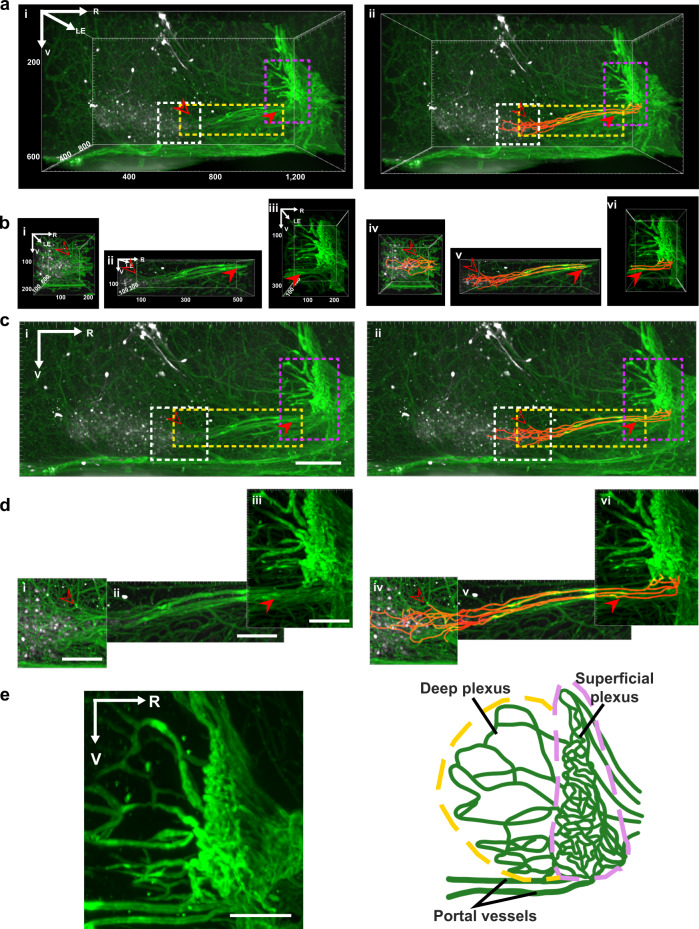
Fig. 2. Sagittal view of portal vasculature between the SCN and OVLT in 3D and maximum intensity projection images.
a–d The left panels show capillaries coursing between the SCN and OVLT and the right panels show the same panels with traced vessels. a, b 3D view of vessels between SCN and OVLT at low (a) and higher (b) magnification. Areas outlined in the boxes in (a) are shown at higher magnification in (b) for the regions (left to right) near the SCN, between the SCN and OVLT, and near OVLT. c, d Maximum intensity projection of data shown in Fig. 2a, b respectively at low (c) and high magnification (d). This view reduces the depth of the scan and enhances visualization of some of the portal vessels coursing between the SCN and OVLT (N = 8 mice). e Maximum intensity projection of an optical slice (left, 100 µm) and accompanying schematic (right) highlight the entry points of portal vessels into the ventral superficial plexus of the OVLT. (N = 8 mice). Legend details: In panels a–d, the open and closed arrows point to a specific vessel lying at the rostral SCN or near the ventral OVLT respectively. Immunostaining labels as in Fig. 1a and orange = tracings of capillaries. For a–b, volume of images is shown in the axes. For c–d, maximum intensity projections depth: 620 µm (i, iv), 350 µm (ii, v), 410 µm (iii, vi). Reference axes: R rostral, LE left; V ventral. Scale bar = 100 µm.

