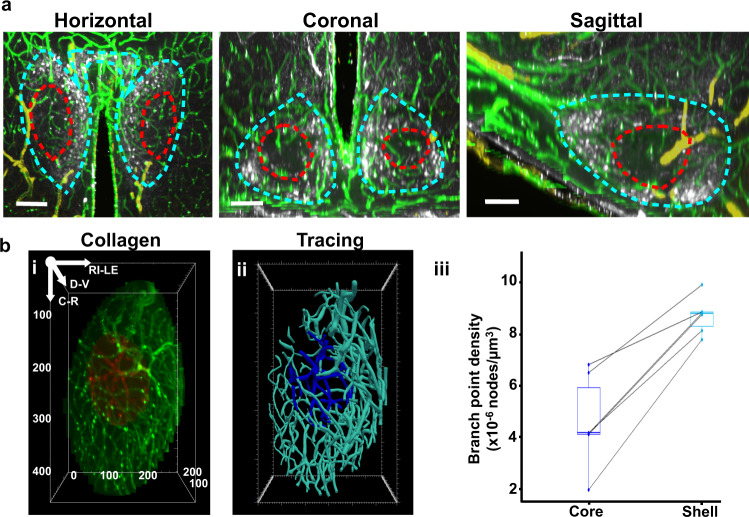
Fig. 4. Capillary network of SCN core vs. shell.
a Optical slices (50 µm) of a representative SCN in horizontal, coronal, and sagittal orientation indicate a denser and more complex vasculature in the AVP-abundant shell (dashed blue line) vs. core (dashed red line) (N = 6 mice). Scale bar = 100 µm. b Core and shell SCN vasculature network. bi Collagen staining of SCN core (red) and shell (green) blood vessels. bii Tracings of SCN core (dark blue) and shell (light blue) blood vessels. biii Comparison of core and shell branch point density (N = 6 SCN). SCN core (dark blue box) vs shell (light blue box): 4.6 ± 1.8 × 10⁻⁶ vs. 8.7 ± 0.7 × 10⁻⁶ nodes/µm3; two-tailed paired t test, t(5) = 7.81, p = 0.00055. The center line of the boxplot refers to median; the upper box limit refers to 75th quantile and the lower limit refers to 25th quartile; whiskers represent 1.5x interquartile range; points beyond whiskers are outliers. A single line connects dots representing measurements of the core and shell branch points from the same SCN.

