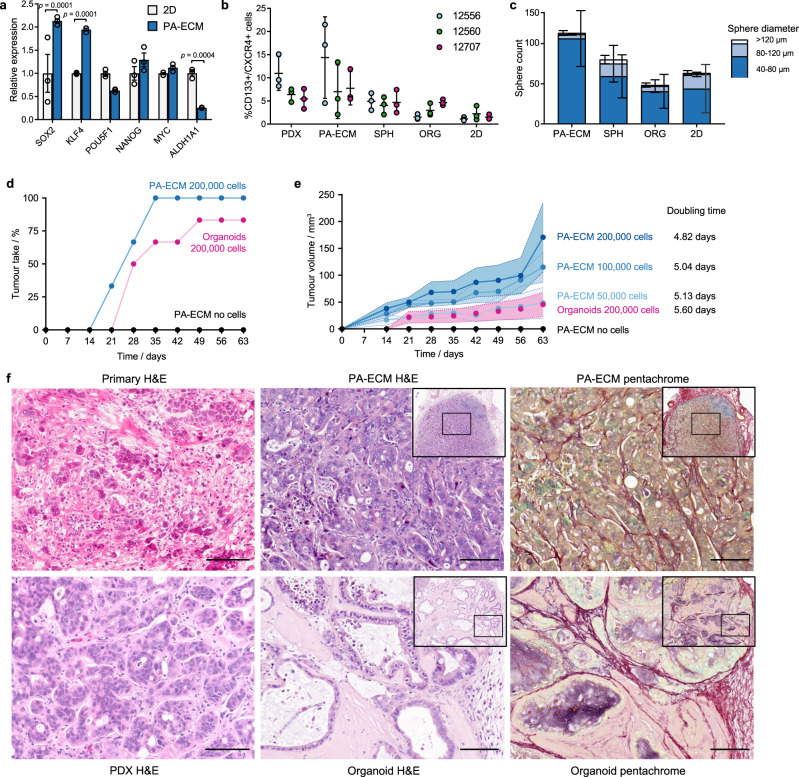
Fig. 4. CSC enrichment in PA-ECM cultures.
a Expression of CSC factors by PDAC cells (12560) cultured in PA-ECM compared to 2D monolayers (mean ± SD; n = 3 biological replicates). b Percentage of CD133 + /CXCR4 + PDAC cells in PDX and ex vivo PDAC models as assayed by flow cytometry in three matched experiments (mean ± SD). c Number of spheres by size range formed by PDAC cells (12560) derived from PA-ECM cultures, primary spheres, organoids and 2D monolayers (mean ± SD; n = 3 biological replicates). d Engraftment rate of PA-ECM and organoid PDAC cultures (12560) implanted in nude mice (three mice with two tumours per condition). e Volume of tumours grown in nude mice from implanted PA-ECM and organoid cultures carrying increasing numbers of PDAC cells (12560) (three mice with two tumours per condition). Shaded areas denote standard deviation around mean. f Representative histology images of PDAC tissues derived from patient 12560, including primary tumour, patient-derived xenografts and tumours grown in nude mice from implanted PA-ECM and organoid cultures. Scale bars: 100 µm.

