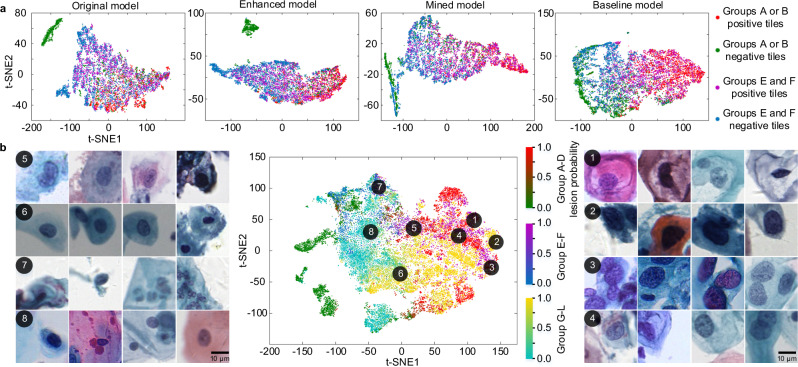
Fig. 7. Generalized and rich feature representations of our models.
a Gradually aligned features between different groups of datasets. The last 2,048-dimensional features of the original, enhanced, and mined models were reduced to two dimensions using t-SNE on the test sets of groups A, E, and F and were plotted in the first three subgraphs respectively. The dimension-reduced features of the baseline model on the test sets of groups A, B, E, and F were plotted in the fourth subgraphs. In all, 1,000 positive test tiles and 1,000 negative test tiles in each group were randomly selected for the visualization. b The distribution of dimension-reduced features of the HR model on the 12 groups test sets and the interpretation of the feature representations by examining the corresponding cervical image tiles. In all, 2,000 test tiles in each group were randomly selected for the feature visualization. The different color bars refer to different groups and the gradient colors within a single color bar refer to the lesion probabilities of tiles.

