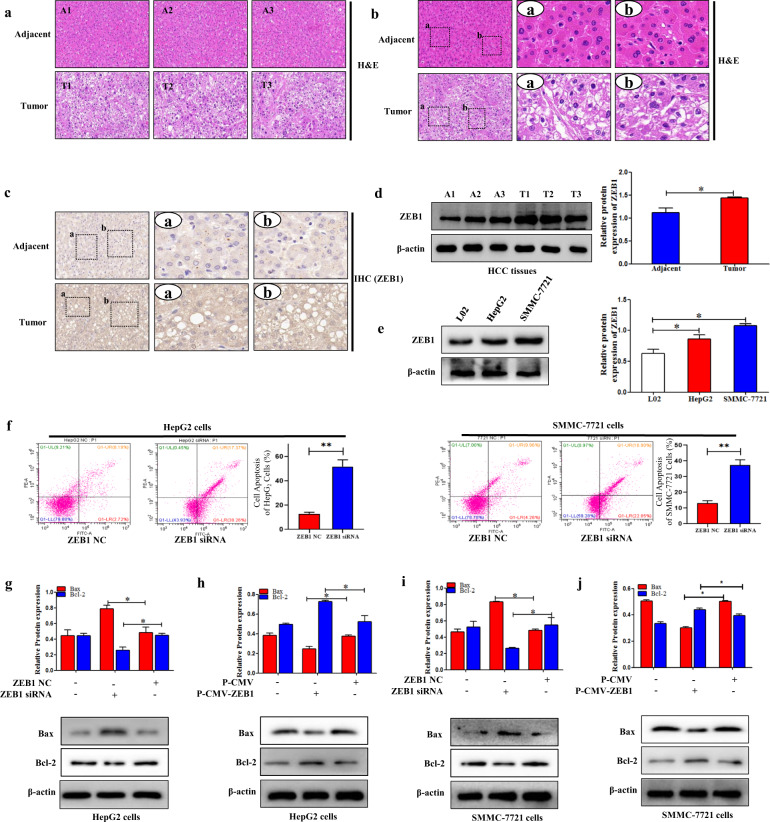
Fig. 1. ZEB1 was aberrantly expressed in human HCC tissues.
a, b The H&E stain in human HCC tissues and adjacent tissues. The rectangular image in the left panel was magnified in the middle and right panels. The scale was shown in the figure. Pannoramic SCAN 150 (3DHISTECH, Budapest, Hungary) was used for the imaging. c The IHC of ZEB1 in human HCC tissues and adjacent tissues. The rectangular image in the left panel was magnified in the middle and right panels. The scale was shown in the figure. Pannoramic SCAN 150 (3DHISTECH, Budapest, Hungary) was used for the imaging. d The protein expression level of ZEB1 was measured by using Western blotting in human HCC tissues compared to the adjacent tissues. e The protein expression level of ZEB1 was measured by using Western blotting in L02, HepG2, SMMC-7721 cells. Data are presented as the mean ± SD of three independent experiments. *P < 0.05, **P < 0.01, compared to the control group. ZEB1 inhibited the apoptosis of HCC cells. f Cell apoptosis was measured by using flow cytometry analysis in HepG2 and SMMC-7721 cells transfected with ZEB1 siRNA. g–j The protein expression levels of Bax, Bcl-2, were measured by using Western blotting analysis in HepG2 and SMMC-7721 cells transfected with P-CMV-ZEB1 and ZEB1 siRNA, respectively. Data are presented as the mean ± SD of three independent experiments. *P < 0.05, **P < 0.01, compared to the control group.

