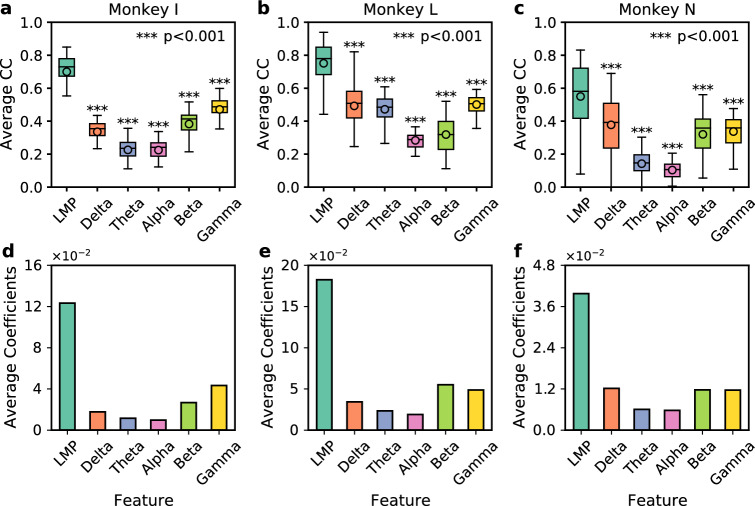
Figure 1.
Comparison of ESA inference across different LFP features from three subjects. (a–c) Boxplot comparison of average CC across LFP features from monkey I, L, and N, respectively. Asterisks indicate LFP features whose inference performance differed significantly from that of LMP (***). The horizontal lines and circles within the boxes indicate the median and mean, respectively. The boxes represent interquartile range (IQR) from 25th to 75th percentiles. The whisker extends 1.5 times the IQR. (d–f) Bar plot comparison of average coefficients (i.e. weights) across LFP features from monkey I, L, and N, respectively.

