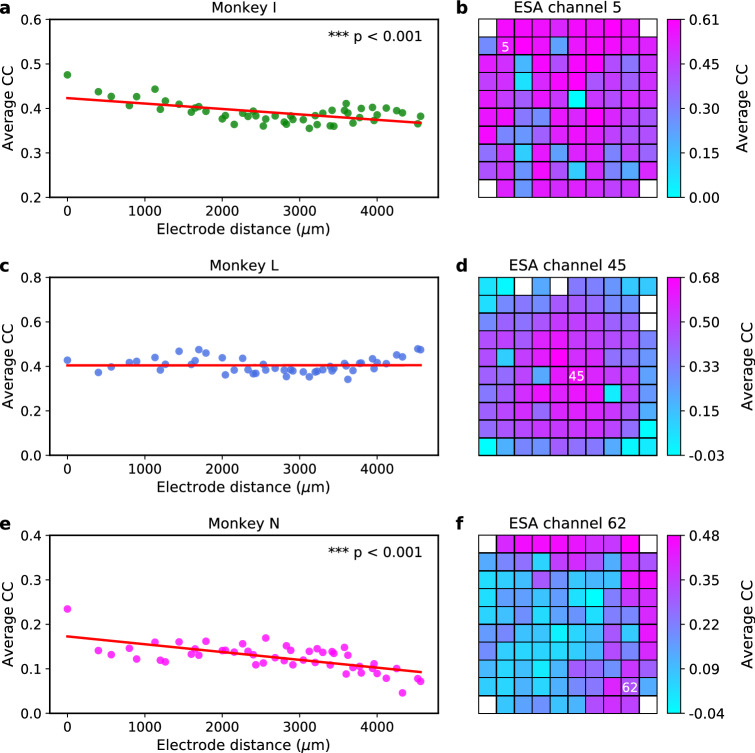
Figure 5.
LFP channel importance score (quantified in terms of average CC) for ESA inference across subjects. (a,c,e) Scatter plot of LFP importance score over inter-electrode distance (μm) from monkey I, L, and N, respectively. Red solid lines represent linear regression lines used to test whether or not there is a significant linear trend between inter-electrode distance and LFP channel importance score. Asterisks indicate that there is a significant linear trend (two-tailed one-sample t test; **, ***). (b,d,f) Examples of heatmap of LFP channel importance score for ESA inference from monkey I (channel 5), monkey L (channel 45), and monkey N (channel 62), respectively. The importance score is mapped onto a grid spatially corresponding to Utah electrode array configuration. white numbers inside the grids denote the ESA channel being inferred. White boxes on the grid represent unused (unconnected) electrodes. The larger the average CC, the more important is the channel for the inference.

