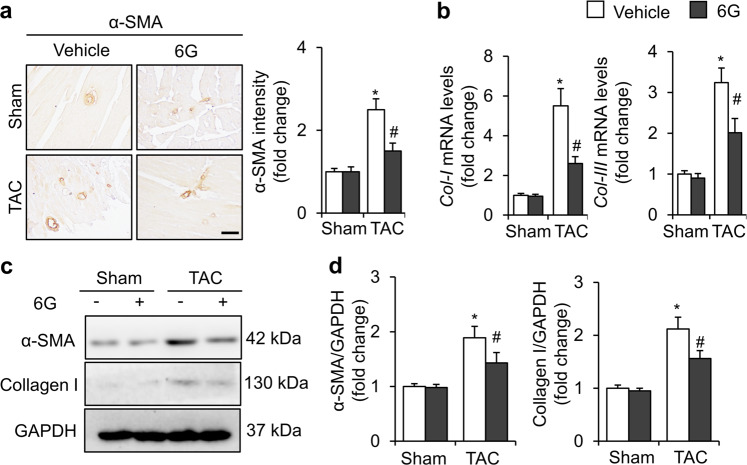
Fig. 2. 6-Gingerol protected against cardiac fibrosis post TAC in vivo.
a Representative immunohistochemical images of α-SMA expression and statistical analysis of the α-SMA intensity (n = 6). b The mRNA levels of fibrotic markers (n = 6). c, d Representative Western blots of α-SMA and collagen expression and the statistical analysis of the protein levels (n = 6). 6G 6-Gingerol. *P < 0.05 vs. the corresponding sham group. #P < 0.05 vs. the TAC+vehicle group.

