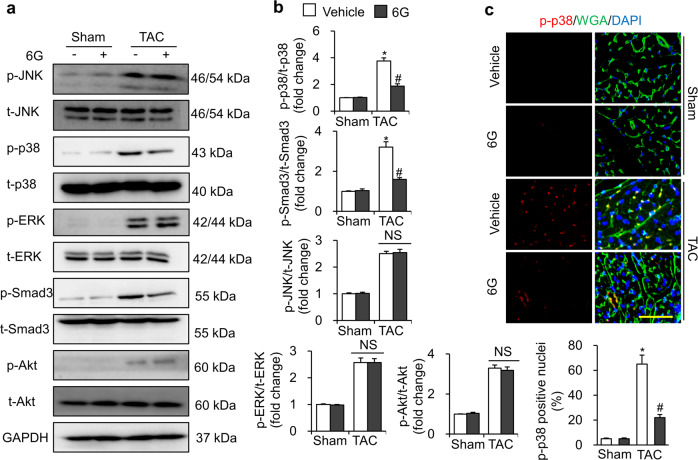
Fig. 4. Alterations in signaling pathways after 6-gingerol treatment.
a Representative Western blots showing total and phosphorylated JNK, p38, ERK, Smad3, and Akt. b The statistical analysis of the Western blot results. (n = 6). c Representative images of immunofluorescence staining for p-p38 and WGA and the percentage of p-p38-positive nuclei (n = 6). 6G 6-Gingerol. *P < 0.05 vs. the corresponding sham group. #P < 0.05 vs. the TAC + vehicle group. NS no statistical significance.

