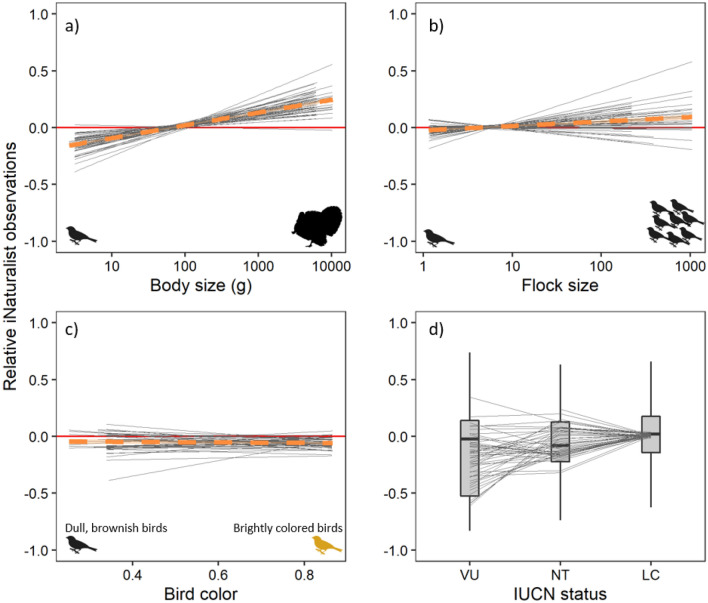
Figure 3.
The relationship between (a) body size of a species, (b) flock size, (c) color and (d) commonness and the residuals of a linear model fit between iNaturalist and eBird observations (see Fig. 1). These empirical results demonstrate that there is a strong bias of body size in iNaturalist compared with eBird. Positive values on the y-axis mean over-represented in iNaturalist and negative values on the y-axis mean under-represented in iNaturalist. Body size and flock size are represented on a log10 scale. Each line represents a state (N = 49). For (a)–(c), the overall relationship pooling states is represented by the orange fitted line and 95% confidence interval. The data represented here were then used in our mixed effects model (see Fig. 4 for results).

