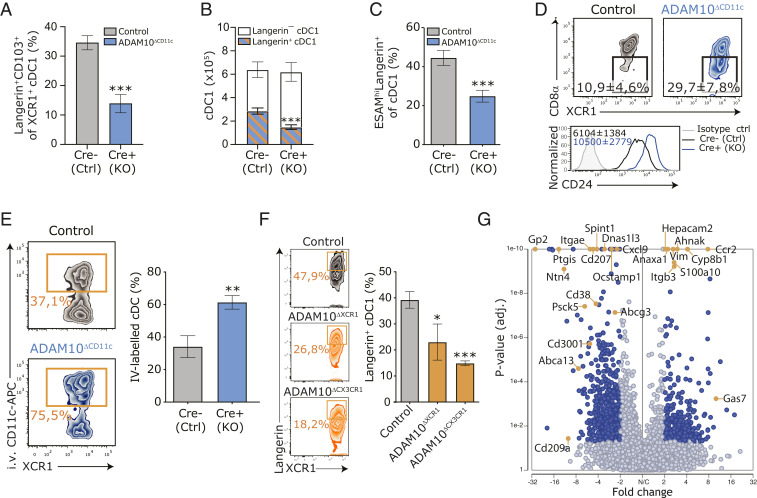
Fig. 2.
ADAM10 controls the terminal differentiation of splenic Langerin+ cDC1. (A) Frequency of Langerin+CD103+ cells within the XCR1+ cDC1 cDC population in spleens of control and ADAM10ΔCD11c mice. (B) Absolute numbers of splenic Langerin+ and Langerin– cDC1 in control and ADAM10ΔCD11c mice. (C) Frequency of ESAMhi cells within the Langerin+ cDC1 subset. (D) Expression of CD8-α and CD24 on splenic cDC1 isolated from control and ADAM10ΔCD11c mice, assessed by flow cytometry gated on CD11c+MHCII+XCR1+ cells. Filled histogram: isotype control. (E) Frequency of in vivo CD11c-labeled cDC1 in spleens of control and ADAM10ΔCD11c mice. (F) Representative flow cytometry plot showing the frequency of splenic Langerin+XCR1+ cDC1 in control (Top), ADAM10ΔXCR1 (Middle), and ADAM10ΔCX3CR1 (Bottom) mice. Bar graph indicates the average frequency of these cells found in the spleen of the indicated mice. (G) Volcano plot representing the gene expression changes in splenic cDC1 from ADAM10ΔCD11c/control mice (P value versus log2 fold change). Genes also significantly changed in CD103+ versus CD103– cDC1 are indicated in red (published dataset) (11). *P < 0.05, **P < 0.01, and ***P < 0.001 (Student’s t test or one-way ANOVA). FACS plots show one representative mouse/group with mean frequencies or mean fluorescent intensities ± SEM. Data are pooled from at least three experiments (n = 4 to 6 mice/experiment). SC-seq-WTA is a visualization of three Cre-negative and three Cre-positive ADAM10ΔCD11c mice.

