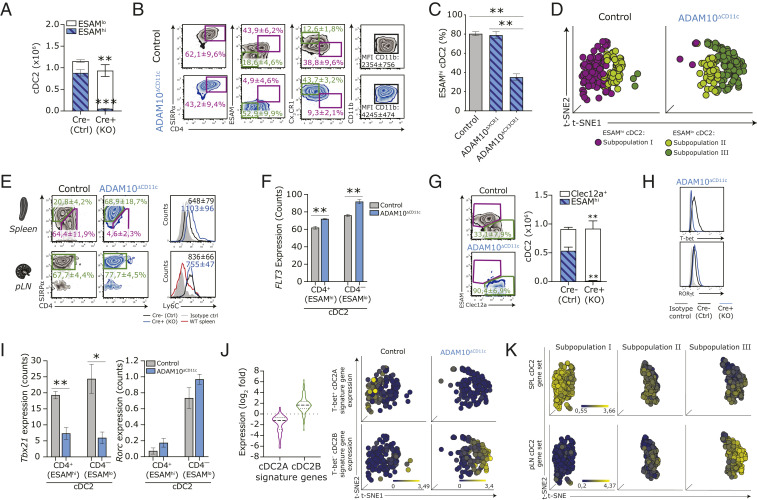
Fig. 3.
ADAM10 deficiency results in the selective absence of splenic ESAMhi cDC2A that is compensated for by an emerging Clec12a+ cDC2B subset. (A) Absolute cell counts of splenic ESAMhi and ESAMlo SIRP-α+ cDC2 in control and ADAM10ΔCD11c mice. (B) Phenotypic comparison of splenic CD11c+MHCII+SIRP-α+ cDC2 isolated from control (Top) and ADAM10ΔCD11c (Bottom) mice, assessed by flow cytometry. (C) Frequency of splenic ESAMhi cDC2 in control, ADAM10ΔXCR1, and ADAM10ΔCX3CR1 mice. (D) t-distributed stochastic neighbor embedding (t-SNE) analysis of SC-seq-WTA profiled control and ADAM10-deficient cDC2 (gated for cells expressing Itgax, H2ab1, and Sirpa) showing automated clustering into an ESAMhi cDC2 subpopulation (subpopulation I, purple) and two ESAMlo cDC2 subpopulations (subpopulations II and III, green). Each dot represents an individual cell. (E) Comparison of the expression of CX3CR1 versus ESAM and Ly6C on SIRP-α+ cDC2 in spleen (Top) and pLN (Bottom) from control and ADAM10ΔCD11c mice assessed by flow cytometry. Filled gray histogram: isotype control. (F) Flt3 RNA expression (Reads Per Kilobase Million) in splenic CD4+ and CD4– cDC2 subsets from control and ADAM10ΔCD11c mice. (G) Flow cytometry plots show the frequency of Clec12a+SIRP-α+ splenic cDC2 in control and ADAM10ΔCD11c mice, while bar graphs represent the absolute numbers of ESAMhi and Clec12a+ cDC2. T-bet and Ror-γT expression, either as protein expression on control and ADAM10-deficient SIRP-α+ cDC2 determined by flow cytometry (H) or as RNA counts (Reads Per Kilobase Million) in bulk-sorted splenic CD11c+MHCII+CD4+ cDC2 (I). (J, Left) Violin plots show the expression of 69 Tbet+ cDC2A-associated key signature genes (purple) and 155 Tbet– cDC2B-associated key signature genes (green) across bulk-sorted CD4+ cDC2 subsets. Expression is log2 fold change between ADAM10 deficient/control. Gene sets are retrieved from published database and accessible as GEO GSE130201 (16). (Right) Unbiased t-SNE representation of SC-seq-WTA depicting cDC2 subpopulations I through III (Left, as in C), indicating the expression levels of the cDC2A-associated gene signature (Top) and the cDC2B-associated gene signature (Bottom) in these cDC2 subpopulations. Each dot represents an individual cell. (K) Unbiased t-SNE representation of SC-seq-WTA depicting cDC2 subpopulations I through III (Left, as in C), indicating the expression levels of splenic cDC2-associated gene signature (comprised of 464 genes, Top) and the pLN-resident cDC2-associated gene signature (comprised of 184 genes, Bottom) in the indicated cDC2 subpopulations. Each dot represents an individual cell. *P < 0.05, **P < 0.01, and ***P < 0.001 (Student’s t test), FACS plots show one representative mouse/group. Data are mean frequencies or mean fluorescent intensities ± SEM of more than five pooled experiments (n = 3 to 5 mice/experiment). RNA expression data are from three Cre-negative and three Cre-positive ADAM10ΔCD11c mice.

