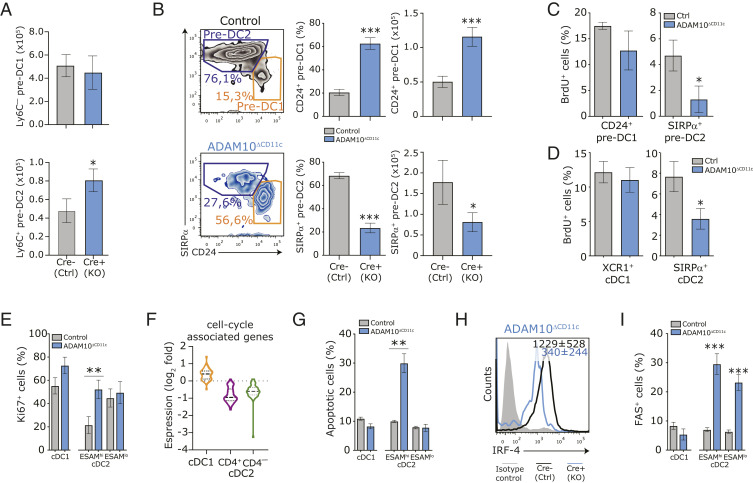
Fig. 4.
ADAM10 is required for splenic cDC2 commitment and differentiation by impacting proliferation and cell survival. (A) Absolute numbers of committed Ly6C– precDC1 (Top) and Ly6C+ precDC2 (Bottom) subsets in spleens of control and ADAM10ΔCD11c mice. PrecDC were defined as Lin–CD11c+MHCII–FLT3+cells. (B) Flow cytometric analysis of SIRP-α and CD24 expression on CD11c+MHCII+CD11b–CD8-α– cells, which represent natural immature stages of cDC2 (aubergine gate) and cDC1 (orange gate) development, respectively. Cells were isolated from control (Top) or ADAM10ΔCD11c (Bottom) spleens. Bar graphs indicate the frequency and absolute numbers of these cells found in the spleen. Control or ADAM10ΔCD11c mice were injected with BrdU and proliferating cells were detected 12 h later as BrdU+ cells among splenic CD24+ precDC1 and SIRP-α+ precDC2 (C) or CD11c+MHCII+ mature splenic XCR1+ cDC1 and SIRP-α+ cDC2 (D). (E) Flow cytometry analysis for the expression of the proliferation-associated marker KI-67 in CD8-α+ cDC1 and CD4+ or CD4– cDC2 subsets isolated from control and ADAM10-deficient mice. (F) Violin plots showing expression of cell-cycle signature genes across bulk-sorted CD11c+MHCII+ CD8+ cDC1 (orange), CD4+ (purple), and CD4– (green) cDC2 subsets. Expression is log2 fold change between ADAM10 deficient/control. Gene sets are retrieved from the publication by Tirosh et al. (60). (G) The frequency of (7AAD+Annexin V+) apoptotic cells among splenic ESAMhi and ESAMlo cDC2 in control and ADAM10ΔCD11c mice. (H) Flow cytometric analysis of IRF-4 expression in splenic CD11c+MHCII+ SIRP-α+ cDC2. Cells were isolated from control or ADAM10ΔCD11c mice. Filled histogram: isotype control. (I) The frequency of FAS (CD95)+ cells among splenic cDC1 and cDC2 subsets in control and ADAM10ΔCD11c mice. *P < 0.05, **P < 0.01, and ***P < 0.001 (Student’s t test); data are pooled from three or more experiments (n = 3 to 5 mice/experiment); FACS plots show one representative mouse/group with mean fluorescent intensity ± SEM.

