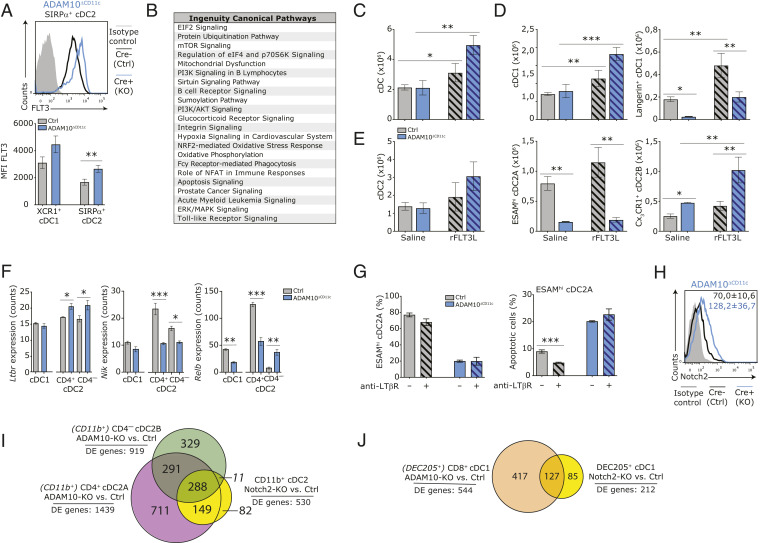
Fig. 5.
ADAM10 controls splenic cDC2 homeostasis via Notch2-dependent but FLT3- and LT-βR–independent pathways. (A) FACS plot shows expression of cell-surface FLT3 on splenic SIRP-α+ cDC2 from control (black) and ADAM10ΔCD11c (blue) mice. Filled gray histogram: isotype control. Bar graph represents quantification of FLT3 expression (mean fluorescent intensities, MFI) on splenic XCR1+ cDC1 and SIRP-α+ cDC2 from control and ADAM10ΔCD11c mice. (B) Canonical pathway analysis (Ingenuity) associated with significantly changed genes between bulk-sorted ADAM10-deficient/control CD4+ cDC2A. Control and ADAM10ΔCD11c mice were treated with recombinant FLT3 ligand (rFLT3L) or saline as control. (C) Absolute number of splenic cDC in saline and rFLT3L treated control and ADAM10ΔCD11c mice. (D) Absolute number of splenic cDC1 (Left) and Langerin+ cDC1 (Right) in saline and rFLT3L-treated control and ADAM10ΔCD11c mice. (E) Absolute number of splenic cDC2 (Left), ESAMhi cDC2A (Middle), and CX3CR1+ cDC2B (Right) in saline and rFLT3L-treated control and ADAM10ΔCD11c mice. (F) Ltbr, Nik, and Relb mRNA expression in bulk-sorted control or ADAM10-deficient splenic CD8-α+ cDC1, CD4+ cDC2, and CD4– cDC2 subsets. (G) Control and ADAM10ΔCD11c mice were treated with agonistic anti–LT-βR antibody or saline as control. Bar graphs shows the frequency of ESAMhi cells among SIRP-α+ cDC2 (Left) or the frequency of apoptotic cells within this population (Right) in saline-treated and antibody-treated control versus ADAM10ΔCD11c mice. (H) Flow cytometric analysis of Notch2 expression on splenic CD11c+MHCII+SIRP-α+ cDC2 from control (black line) and ADAM10ΔCD11c (blue line) mice. Filled gray histogram: isotype control. (I) Venn diagram summarizing the pair-wise overlap of significant differentially expressed genes (DE genes) between ADAM10-deficient/control CD11c+MHCII+CD4+ cDC2A (purple), ADAM10-deficient/control CD4– cDC2B (green), and Notch2-KO/control CD11b+ cDC2 (yellow). Data from Notch2-KO/control CD11b+ cDC2 are retrieved from GEO, accession no. GSE45698 (44). (J) Venn diagram summarizing the pair-wise overlap of significantly changed genes between ADAM10-deficient/control CD8-α+ cDC2 (orange) and Notch2-KO/control CD205+ cDC1 (yellow). Data from Notch2-KO/control CD205+ cDC1 are retrieved from GEO, accession no. GSE45698 (44). *P < 0.05, **P < 0.01, and ***P < 0.001 (Student’s t test); data are pooled from two or more experiments (n = 3 to 6 mice/experiment); FACS plots show one representative mouse/group with mean frequencies or mean fluorescent intensity ± SEM.

