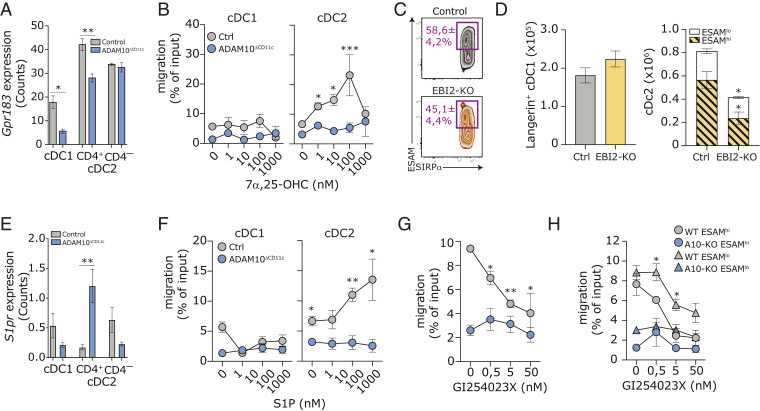
Fig. 6.
ADAM10 regulates EBI2-mediated migration of cDC2 in vitro. (A) Gpr183 (Ebi2) transcript expression in bulk-sorted control or ADAM10-deficient splenic CD8-α+ cDC1, CD4+ cDC2, and CD4– cDC2. (B) In vitro transwell migration of CD11c-purified control and ADAM10-deficient cDC toward indicated concentrations of 7α,25-OHC. Migration was calculated as the ratio of the number of cells migrating with/without chemoattractant; migration of cDC1 and cDC2 subsets was determined by staining for XCR1 and SIRP-α, respectively. (C) Representative flow cytometry plot with average frequencies of splenic ESAMhiSIRP-α+ cDC2 in control and ADAM10ΔCD11c mice. (D) Absolute numbers of splenic Langerin+ cDC1 (Left) and absolute cell counts of splenic ESAMhi and ESAMlo SIRP-α+ cDC2 (Right) in control and EBI2-KO mice. (E) S1pr transcript expression in bulk-sorted control or ADAM10-deficient splenic CD8-α+ cDC1, CD4+ cDC2, and CD4– cDC2. (F) In vitro transwell migration of CD11c-purified control and ADAM10-deficient cDC toward indicated concentrations of S1P. (G) In vitro transwell migration of WT and ADAM10-deficient CD11c-purified cDC toward 10 μM 7α,25-OHC in the presence of indicated concentrations of the ADAM10-inhibitor GI254023X. (H) In vitro transwell migration of ESAMhi and ESAMlo cDC2 in the presences of ADAM10-inhibition as in F. *P < 0.05, **P < 0.01, and ***P < 0.001 (Student’s t test). Migration data represent mean frequencies ± SEM of four pooled experiments (n = 3 mice/experiment), while bulk RNA-seq and SC-seq-WTA data both represent three control and three ADAM10-deficient samples.

