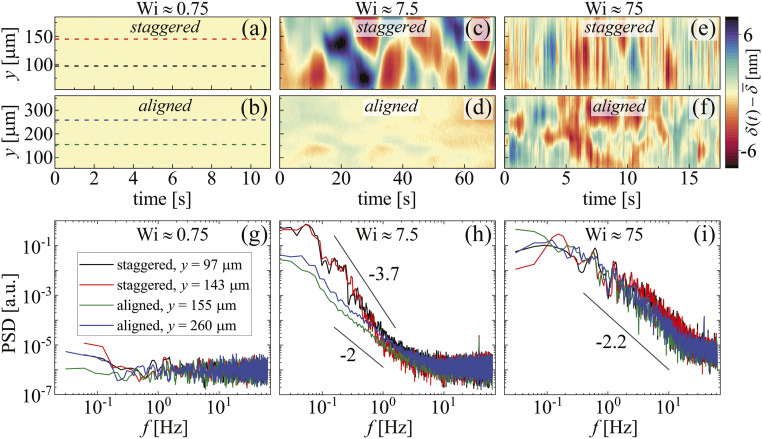
Fig. 5.
Analysis of retardation fluctuations about the local mean in the ordered staggered and aligned arrays (). Kymographs of the fluctuations along for (A and B) , (C and D) , and (E and F) . PSD distributions of the fluctuations for (G) , (H) , and (I) , taken along the correspondingly colored horizontal dashed lines in A and B.

