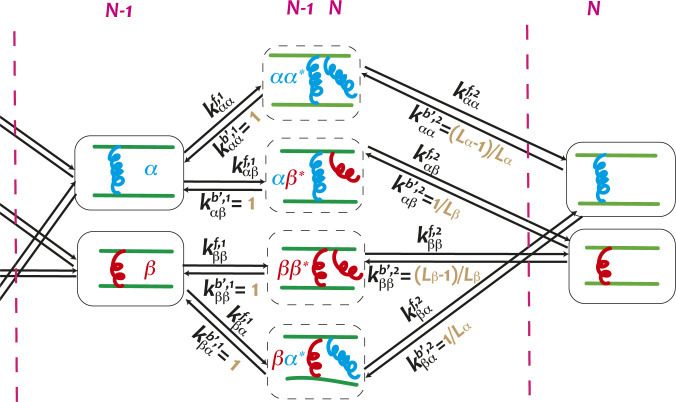
Fig. 3.
Schematic of the model. The states between the two pink dashed lines contribute to the th ABP binding. Arrows link states between which transitions are allowed. and are the forward and backward rates, where and are the types of the last two ABPs at the tip and represents a half-bound state. The rates used in the KMC simulations and in the master equation are compared in SI Appendix, Table S1.

