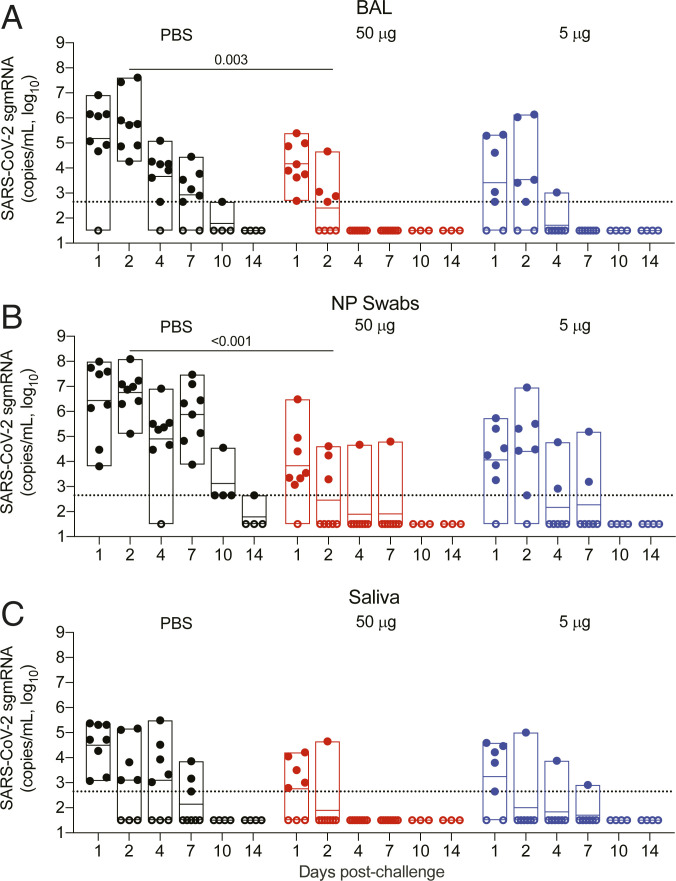
Fig. 3.
Viral replication in the lower and upper airways after RFN vaccination and subsequent SARS-CoV-2 respiratory challenge. The sgmRNA for the E (Envelope) target (copies per milliliter) were measured following challenge in (A) BAL, (B) NP swabs, and (C) saliva of vaccinated and control animals for 1 wk (n = 7 or 8 per group) or 2 wk (n = 3 or 4 per group) following IN and IT SARS-CoV-2 (WA1/2020) challenge of vaccinated and control animals. Specimens were collected 1, 2, 4, 7, 10, and 14 d postchallenge. Dotted lines demarcate assay lower limit of linear performance range (log 10 of 2.65 corresponding to 450 copies per mL); positive values below this limit are plotted as 450 copies per mL. Open symbols represent animals with viral loads below the limit of detection of the assay. Box plot horizontal lines indicate the mean; top and bottom reflect the minimum and maximum. Significant differences between control and vaccinated animals at day 2 postchallenge are indicated. Significance was assessed using a Kruskal−Wallis test followed by a Dunn’s posttest.

