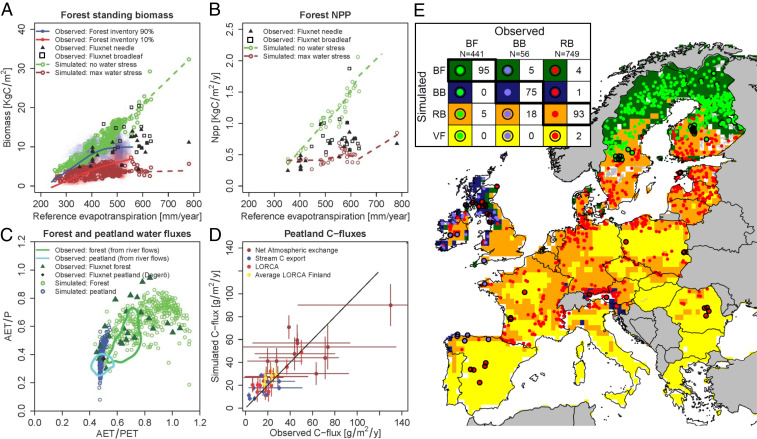
Fig. 2.
Observed versus simulated properties for forests and peatlands. Model comparison with observed relationships between reference evapotranspiration and forest biomass (A), forest net primary production (B), forest and peatland water fluxes (C), and peatland carbon fluxes (D) (refer to SI Appendix, Water and Carbon Stores and Fluxes for the locations of the sites and forest soil carbon). In A and B, we simulated forests that have an optimal water supply (green dots) and forests that cannot reach saturated groundwater (dry forests, brown dots). The brown and green dashed lines represent smoothed lines through the simulated values for the same locations. The percentages 90 and 10% in the legend of A refer to the 0.9 and 0.1 percentile biomass for forests older than 60 y (SI Appendix, Model Example). The green and blue solid lines (C) are estimates of peatland and forest water usage derived from river runoff in Sweden (11). The black solid line (D) is the 1:1 line, and the horizontal bars indicate year-to-year variability when multiple years are measured, while the vertical bars indicate the SD of the year-to-year modeled fluxes. (Refer to SI Appendix, Fig. S2.1 for additional validation with Canadian datasets). Validation and verification of potential peatland type classification (Classification) with recorded spatial distribution of peatland types (E) [>1,200 sites, Natura 2000 ecotypes (38); BF = boreal fen, BB = blanket bog, RB = raised bog, VF = valley fen]. Dots and grids represent observed and simulated peatland types, respectively. Black circled dots indicate wrongly simulated peatland types (wrong when distance between observed type and corresponding simulated type are >80 km). The color legend is given by colors in the confusion matrix (Inset in E). The numbers in the confusion matrix represent percentages of occurrence of that combination of observation and simulation (100% is perfect). All gray countries (E) are not covered by the Natura 2000 dataset.

