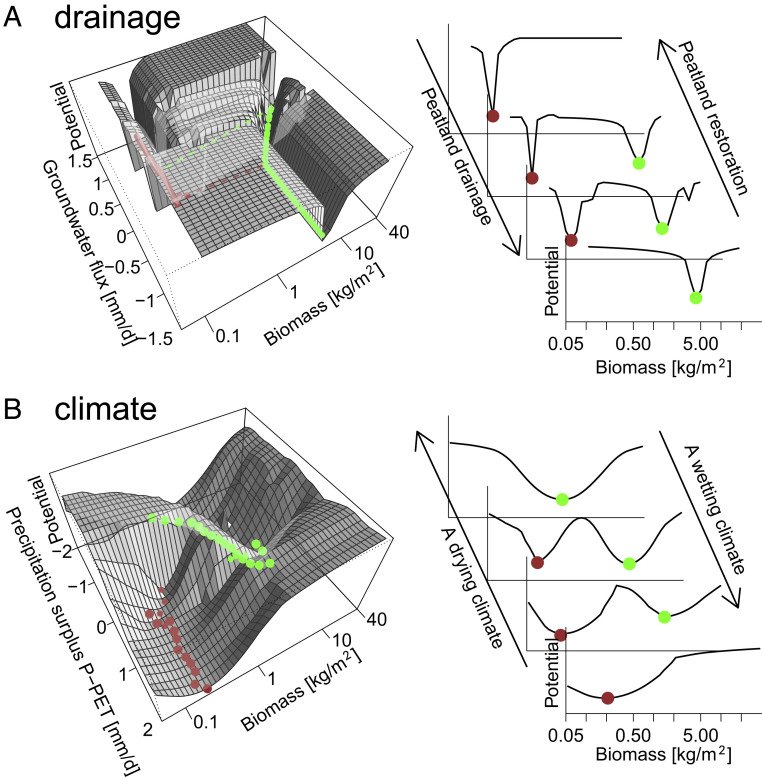
Fig. 3.
Ecosystem stability landscapes (42) show restoration resistance (range in groundwater fluxes between two clear minima) against drainage for a single location (A) and climate change based on model results for all Europe (B). Green dots indicate a high biomass forest state, while brown dots indicate a peatland state. Potential (y-axis) is calculated by log(1/probability)36, where probability represents the probability of a certain biomass during the last 200 y of simulation (for one site [A], for all sites and zero groundwater flux [B].

