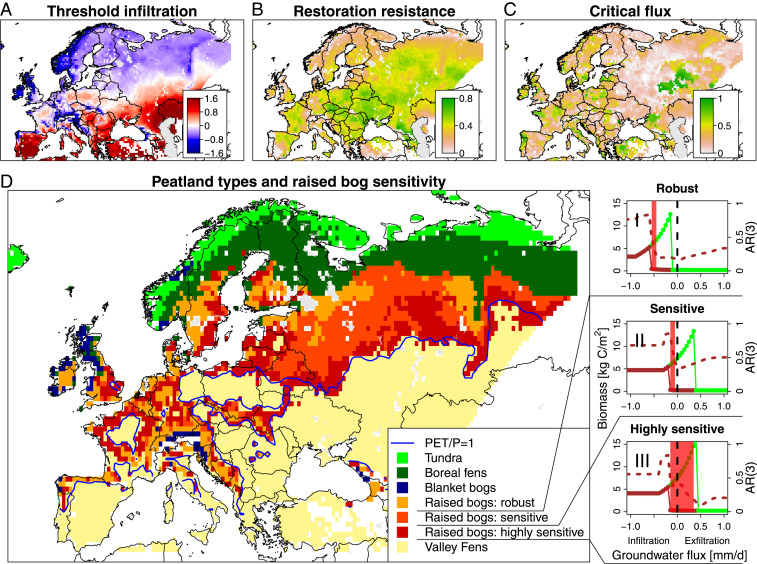
Fig. 4.
Resilience of potential raised bogs. The indicators (A–C) together identify regions with the most sensitive raised bogs (D). (I to III) The bistability diagrams for robust, sensitive, and highly sensitive raised bogs. The black dashed line indicates zero groundwater flux, which identifies potential raised bog sites (II), while the red shaded range indicates the groundwater fluxes over which “critical slowing down” is simulated [AR (3) brown dashed line]. Critical slowing down occurring from TIP into exfiltration conditions is defined highly sensitive raised bog (III). The blue line in D indicates a dryness index equal to 1.

