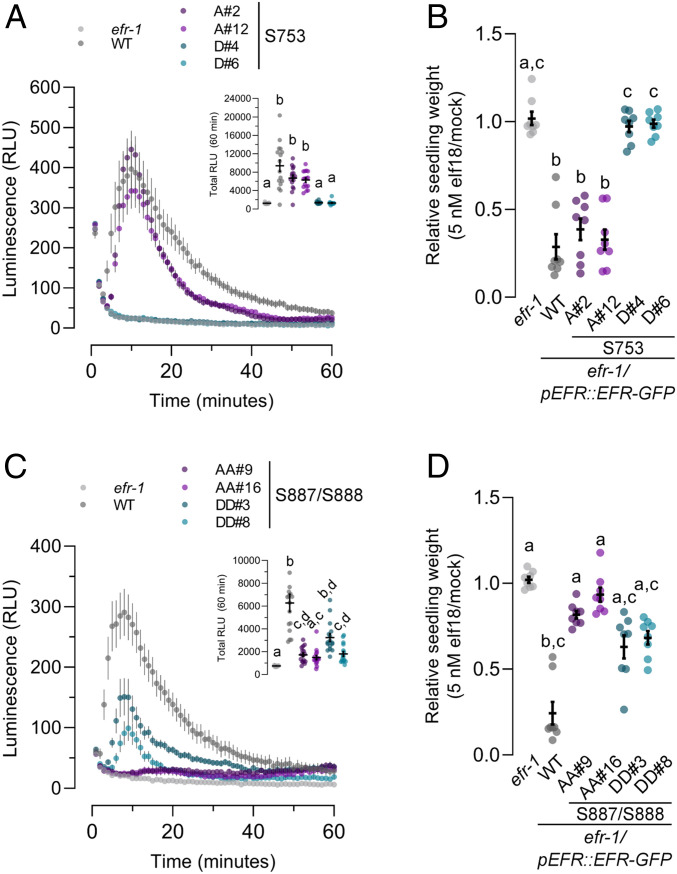
Fig. 6.
Analysis of PTI responses in EFR phosphorylation site mutants. (A and C) Oxidative burst in leaf discs from the indicated genotype after treatment with 100 nM elf18. Points represent mean with SEM. Inset shows mean with SEM of total luminescence over 60 min. Means with like letter designations are not statistically different (Kruskal–Wallis ANOVA, n = 16 leaf discs, P < 0.000001, Dunn’s multiple comparisons test). (B and D) Seedling growth of the indicated genotypes in the presence of 5 nM elf18. Data are shown relative to mock treated seedlings for each genotype. Individual data points with mean and SEM are shown. Means with like letter designations are not statistically different (B, Kruskal–Wallis ANOVA, P = 0.00001, n = 8 seedlings, Dunn’s multiple comparison test; D, Kruskal–Wallis ANOVA, P < 0.000001, n = 8 seedlings, Dunn’s multiple comparison test). All experiments presented were repeated three times with similar results.

