
Figure 3. Estimates of the Survival Curves for Stroke and Heart Failure Outcomes and 2 Insulin Regimens .
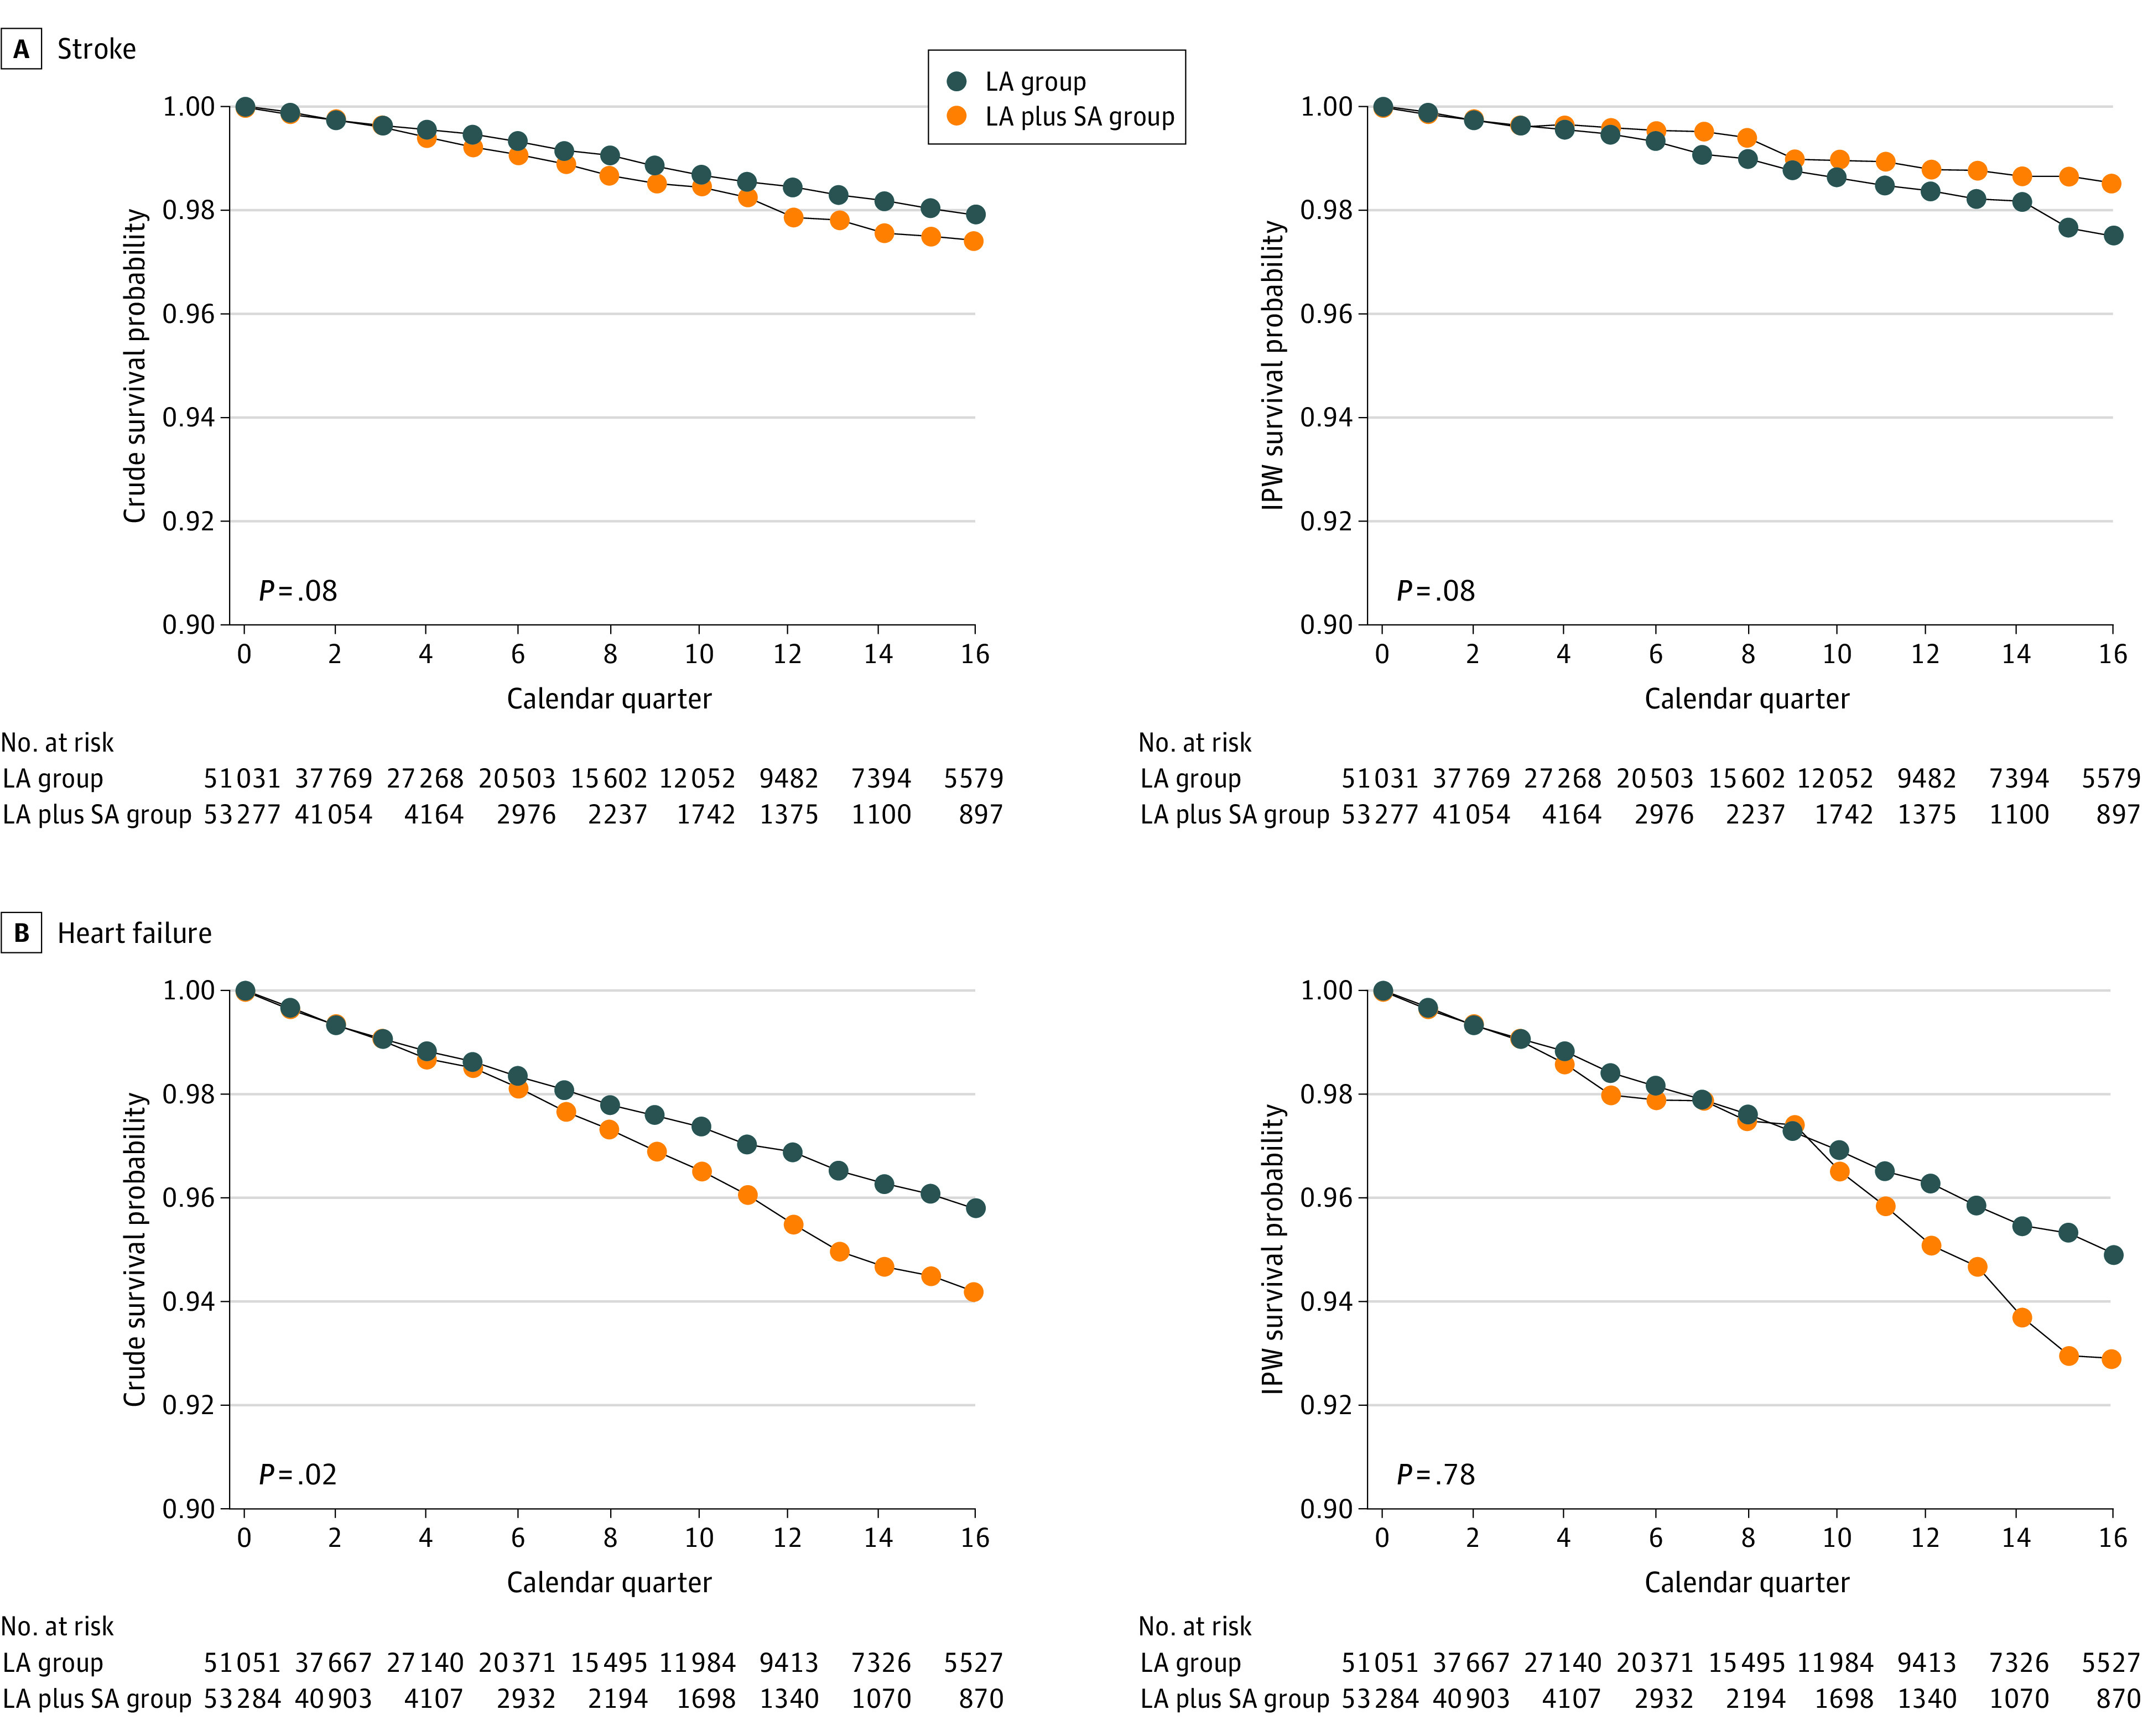
Estimates are derived from a saturated marginal structural model for the counterfactual hazards. The 2 plots in each row display the unadjusted (left) and adjusted (right) estimates of survival probabilities over time and by therapy regimen for each outcome. The P value of the statistical test for the area between the 2 survival curves is null (ie, the sum of the risk differences at each quarter is equal to 0) (eFigure 2 in the Supplement). IPW indicates inverse probability weighting; LA, long-acting insulin; and LA plus SA, long-acting plus short-acting insulin.