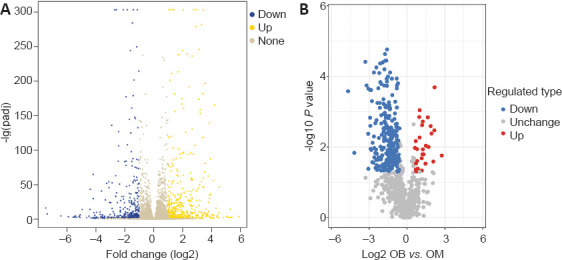
Figure 2.

Quantitative volcano map of differentially expressed genes (A) and proteins (B) of olfactory ensheathing cells from olfactory bulb compared with olfactory mucosa.
The x-axis is the expression multiple change, the y-axis is the statistical significance of the expression change; different colors indicate different classifications. For OB compared with OM, blue represents down-regulated genes or proteins, yellow and red represent up-regulated genes or proteins, and gray represents genes or proteins with no significant difference in expression. OB: Olfactory bulb; OM: olfactory mucosa; padj: P-value adjusted.
