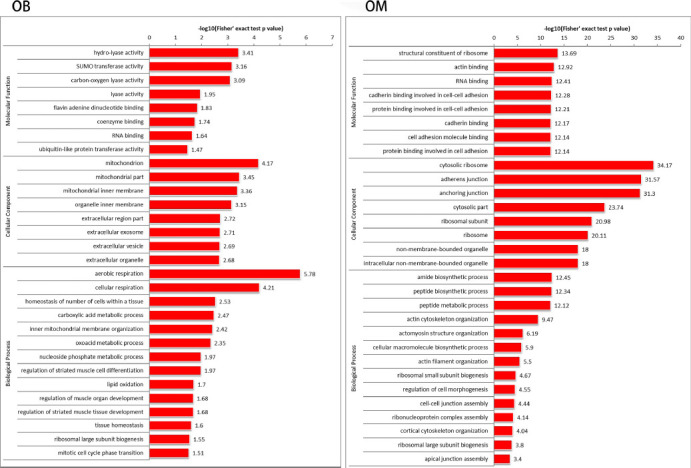
Figure 4.

Functions of OB and OM differentially expressed proteins in GO.
The enrichment distribution bar graph is separated by classification. The y-axis describes the GO terms; the x-axis is the P-value of Fisher's exact test. The most overexpressed proteins of OB are related to “hydro-lyase activity,” “mitochondrion” and “aerobic respiration”; the most overexpressed proteins of OM are related to “structural constituent of ribosome,” “cytosolic ribosome” and “amide biosynthetic process.” GO: Gene ontology analysis; OB: olfactory ensheathing cells derived from the olfactory bulb; OM: olfactory ensheathing cells derived from the olfactory mucosa.
