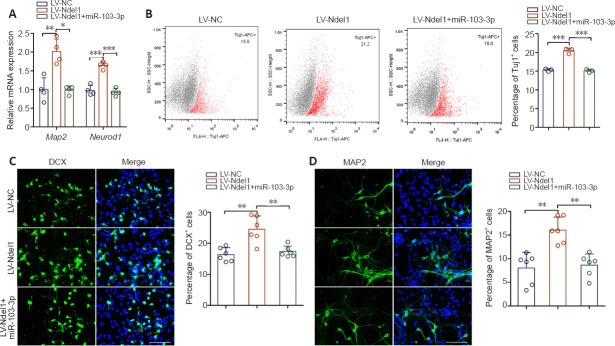
Figure 5.
miR-103-3p regulates NSC differentiation by targeting Ndel1.
(A) Map2 and Neurod1 mRNA expression levels were detected by quantitative polymerase chain reaction. The relative mRNA expression levels were normalized to LV-NC. (B) Flow cytometry detection of Tuj1-positive cells after transfection. (C, D) Representative images and quantification of DCX- (green, stained with Alexa Fluor488) and MAP2- (green, stained with Alexa Fluor488) positive cells. The LV-Ndel1 group had a higher ratio of DCX- and Map2-positive cells to DCX- and Map2-negative cells than the other two groups. Scale bars: 100 μm. Data are expressed as the mean ± SD. Each point represents one independent experiment performed in duplicate. *P< 0.05, **P< 0.01, ***P< 0.001 (one-way analysis of variance followed by Tukey's post hoc test). DCX: Doublecortin; MAP2: microtubule-associated protein 2; Ndel1: NudE neurodevelopment protein 1-like 1; Neurod1: neuronal differentiation 1; NSC: neural stem cell; Tuj1: class III beta-tubulin.

