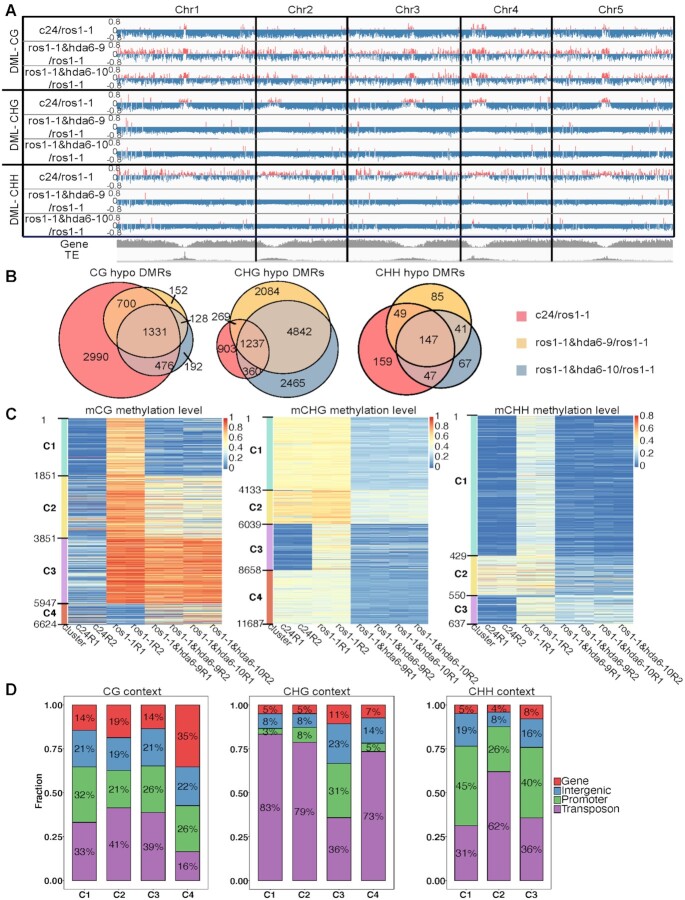
Figure 2.
Genome-wide distributions of DNA methylation levels in Arabidopsis ecotype C24, ros1-1, ros1-1&hda6-9, and ros1-1&hda6-10. (A) An IGV plot showing the distributions of differentially methylated loci (DMLs) in C24/ros1-1, ros1-1&hda6-9/ros1-1, and ros1-1&hda6-10/ros1-1 in the CG, CHG and CHH contexts along the five chromosomes, with the corresponding genic and transposable element (TE) regions at the bottom in grey. Red: hypermethylated DMLs; blue: hypomethylated DMLs. (B) Venn diagrams showing the overlapping hypo-DMRs (differentially methylated regions) among the C24/ros1-1, ros1-1&hda6-9/ros1-1 and ros1-1&hda6-10/ros1-1 comparisons in the CG, CHG and CHH contexts. (C) Heat maps of DMR clusters sorted according to their relative DNA methylation levels across the four genotypes. Each genotype is presented with two replicates (R1 and R2). (D) Proportions of the DMRs being located in each of the four genomic regions (gene, intergenic, promoter and transposon) within each cluster from (C) in the CG, CHG and CHH contexts respectively.

